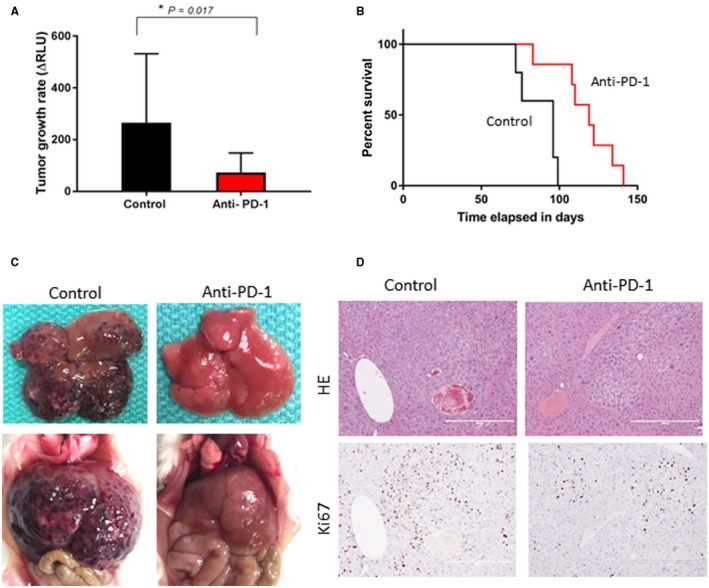
Figure 1.

Efficacy of anti‐PD‐1 therapy. HCC was induced by HDI of MET/β‐catenin. Starting at 3 weeks after HDI, mice were treated with anti‐PD‐1 or control diluent for 2 weeks. (A) Tumor growth rate on treatment was determined as a change in g‐luc expression between 3 and 9 weeks after HDI (*P = 0.017). Data are presented as mean ± SEM from eight control and 12 anti‐PD‐1‐treated animals. (B) Survival curves of control or anti‐PD‐1‐treated groups estimated by Kaplan‐Meier analysis (P < 0.01 between groups by log‐rank test). (C) Gross appearance of livers ex vivo and in situ. (D) Representative liver sections showing H&E and immunohistochemistry for Ki67 (original magnification ×10). Abbreviation: HE, hematoxylin and eosin.
