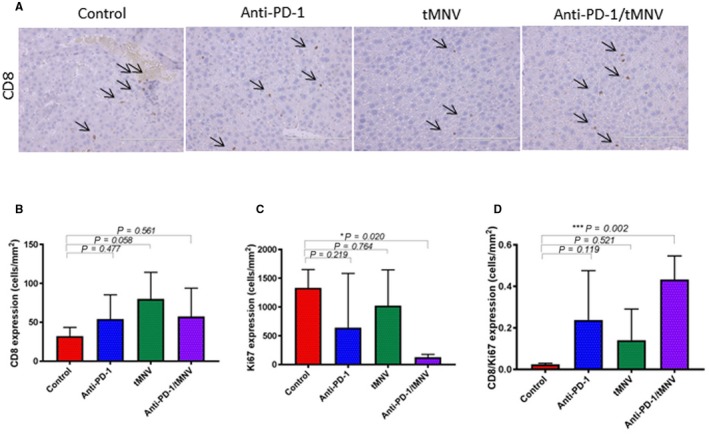
Figure 6.

CD8 T‐cell infiltration and proliferation in the tumor microenvironment. (A) CD8 expression in representative liver sections by immunohistochemistry using CD8 rabbit polyclonal antibody (dilution 1:75). Arrows indicate CD8‐positive cells. Original magnification ×20; scale bars, 200 μm. (B) Quantitation of CD8‐positive cells. There is no significant difference in average density between groups (*P > 0.01). (C) Quantitation of Ki67‐positive cells. There is a reduction in Ki67 density in anti‐PD‐1‐ and anti‐PD‐1/MNV‐treated groups compared with controls. (D) Ratio of CD8:Ki67‐positive cells. There is an increase observed with the anti‐PD‐1/MNV group compared with controls. Data represent the mean value ± SEM; one‐way ANOVA was used for analysis.
