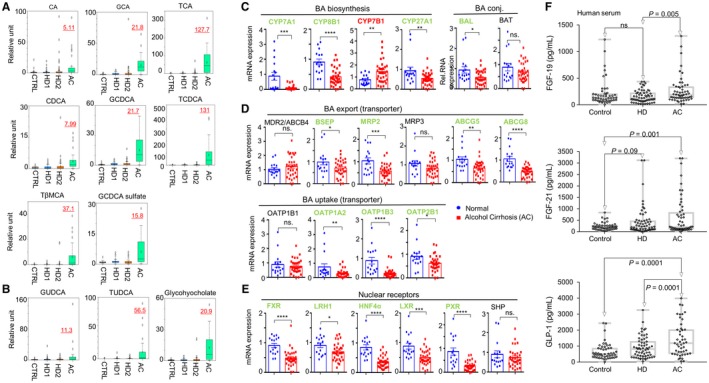
Figure 2.

Primary and secondary BAs. Each Color represents a study group. Box plots demonstrating relative levels of (A) primary BAs and (B) secondary BAs among the study cohorts. (C‐E) qRT‐PCR of hepatic mRNA expression of genes related to (C) BA biosynthesis, (D) BA export and uptake, and (E) nuclear receptors regulating BA synthesis in controls and patients with AC. *P < 0.05, **P < 0.01, ***P < 0.001, ****P < 0.0001. (F) Serum levels of FGF19, FGF21, and GLP‐1 in controls, HDs, and those with ALD. Abbreviations: CA, cholate; GCA, glycocholate; SHP, small heterodimer partner; TβMCA, tauro‐beta‐muricholate.
