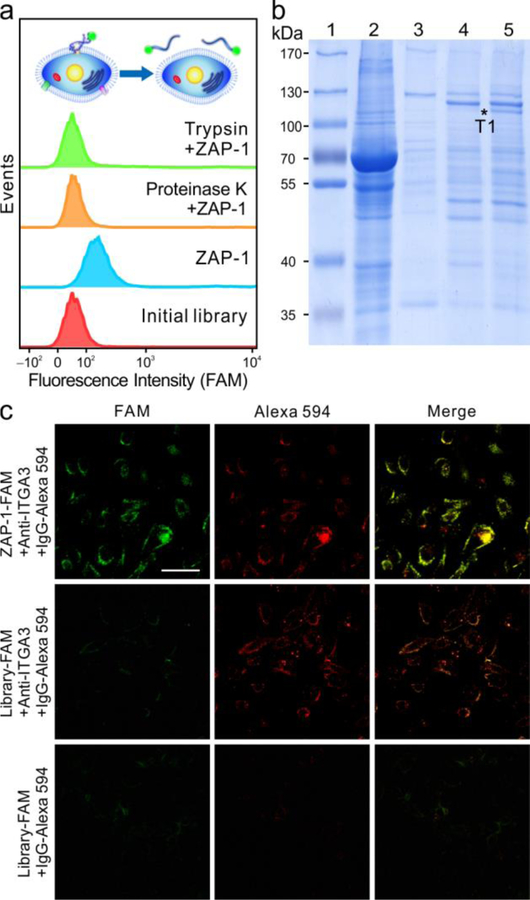
Figure 2.
Analysis and verification of ZAP-1-targeted protein. (a) Flow cytometry of FAM-labelled initial library (red) and ZAP-1 (blue) with MDA-MB-231 cells treated with proteinase K (orange) and trypsin (green). (b) SDS-PAGE was used to identify ZAP-1-specific band T1, marked as asterisk. 1, marker; 2, cell lysate; 3, beads only; 4, proteins captured by initial library; 5, proteins captured by ZAP-1. (c) Fluorescence confocal images of MDA-MB-231 cells incubated with ZAP-1 and anti-ITGA3. (Scale bar, 50 μm.)

