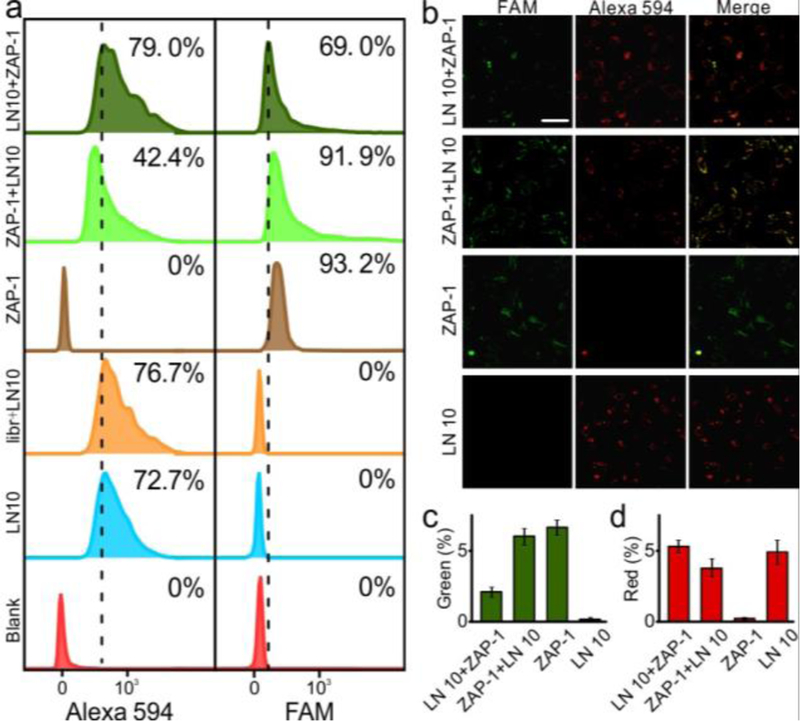
Figure 3.

Flow cytometry analysis and fluorescence confocal images of MDA-MB-231 cells incubated with LN10 (Alexa 594) and aptamer ZAP-1 (FAM). (a) Flow cytometry analysis to monitor the binding ability of LN10 and ZAP-1. Percentage of cells above the autofluorescence of cells (dash line) was listed in each sample. (b) Fluorescence confocal images of cells incubated with ZAP-1 and LN 10. Quantified results were shown in c (green channel) and d (red channel). Each bar represents the mean ± SD. (Scale bar, 50 μm.)
