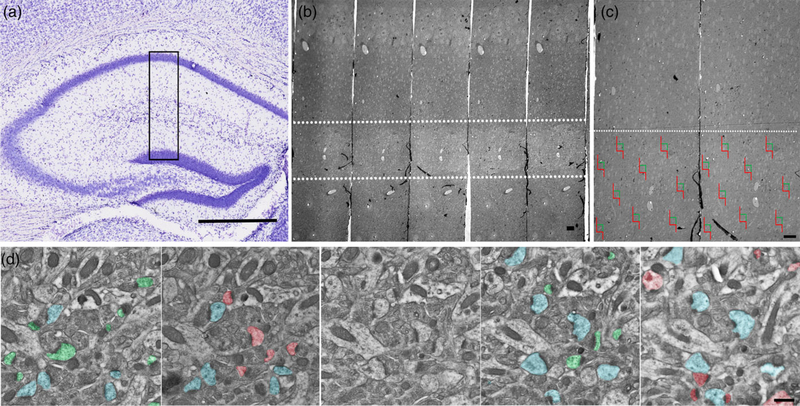
FIGURE 1.
Schematic depicting the unbiased stereological approach taken to quantify synapses. (a) EM blocks were cut encompassing mouse CA1 SR region (black box), (b) serial sections were collected and imaged between 150 and 250 μm from the cell bodies in the pyramidal layer of CA1 (white dashed lines). (c) Example of randomized imaging protocol using physical disector approach. (d) Serial electron micrographs depicting axospinous synapses counted using the disector method. Only synapses that are present in the reference panel (green and red), but not in the look-up panel was counted. Synapses present in both panels (blue) were not included in the analysis. Scale bars: a 500 μm; b 10 μm; c 10 μm; d 500 nm

