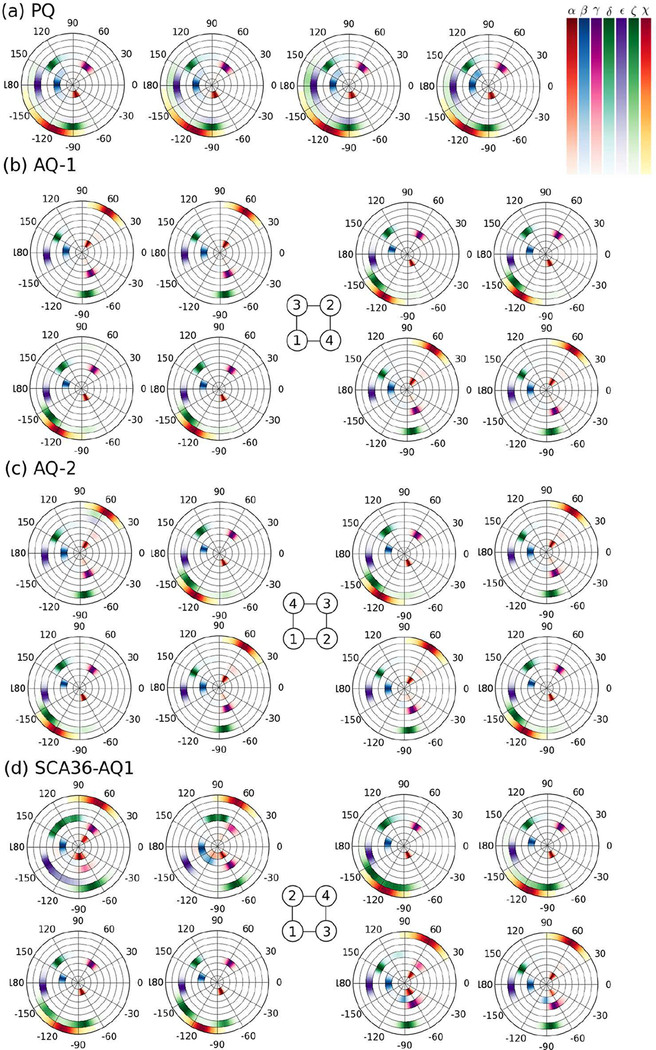
Figure 6.
Density distribution of backbone and glycosidic torsion angles for DNA. Distributions of backbone torsion angles (α, β, γ, δ, ϵ, ζ) and glycosidic torsion angle χ are shown from the inner to the outer circular rings for each base at the middle G-layers during the last 500 ns of the simulations. (a) PQ (second G-layer) (b) AQ-1 (second (left) and third (right) G-layers) (c) AQ-2 (second (left) and third (right) G-layers) (d) SCA36-AQ1 (first (left) and second (right) G-layers). For the antiparallel models, the strands’ orientation–as sketched in Figure 1– is shown in the central schemes.

