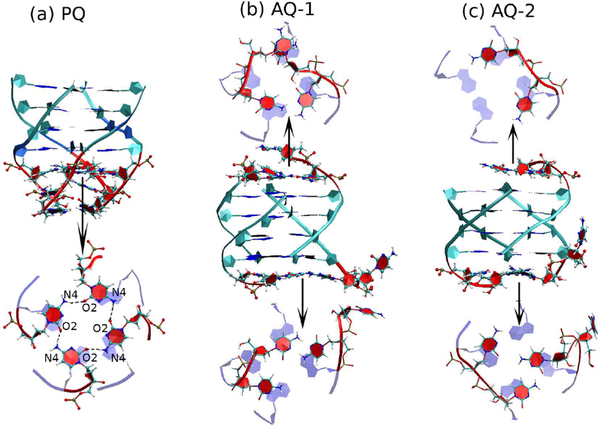
Figure 8.
C-Layers coupled to the G-quadruplexes in DNA. This figure shows snapshots of DNA conformations where the C bases at the end of the quadruplexes form flat layers. Top projections are depicted in the 5′→3′ direction while bottom ones are shown in the 3′→5′ direction. (a) PQ model with a symmetric C-tetrad; (b) AQ-1; (c) AQ-2.

