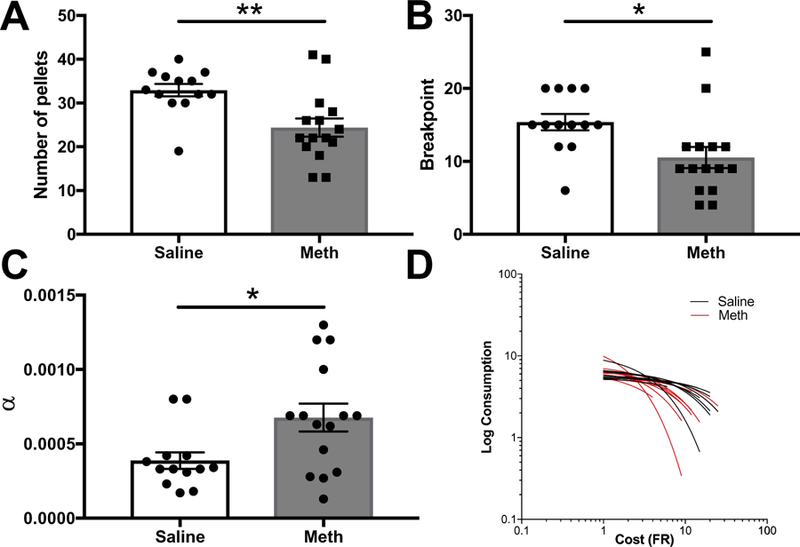
Fig. 4.

Effects of meth IVSA withdrawal on behavioral economic indices. (A) Number of pellets earned on the last of the three stable PR testing sessions in yoked saline and meth IVSA groups. Meth exposed animals earned fewer pellets compared to yoked saline controls (p < 0.01). (B) Breakpoint (highest ratio achieved) on the last of the three stable choice testing sessions in yoked saline and meth IVSA groups. Meth exposed animals reached lower ratios compared to yoked saline controls (p < 0.05). (C) α values calculated from Hursh and Silberberg’s exponential model. Meth exposed animals had steeper rates of decline, as indicated by higher α (p < 0.05). (D) Individual demand curves generated from Hursh and Silberberg’s exponential model. Points denote mean ± SEM, *p < 0.05, **p < 0.01.
