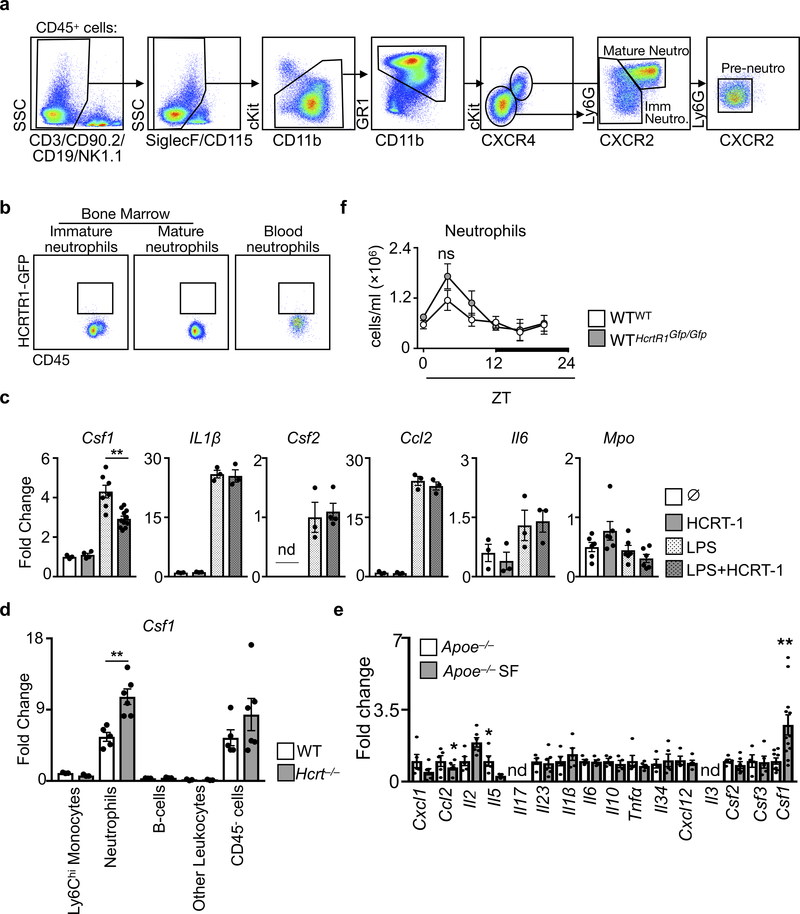
Extended Data Figure 9. Hypocretin, bone marrow neutrophils, and HcrtR1.
a, Flow cytometry gating strategy for bone marrow pre-neutrophils, immature neutrophils and mature neutrophils. b, HCRTR1 (GFP) in bone marrow and blood neutrophils from WTHcrtR1Gfp/Gfp mice. c, mRNA expression in cultured bone marrow pre-neutrophils exposed to LPS and/or HCRT-1 (for untreated n=3 except Mpo n=6; for HCRT-1 n=3 expect Csf1 n=4 and Mpo n=6; for LPS n=3 except Csf1 n=7 and Mpo n=6; for LPS+HCRT-1 n=3 except Csf1 n=11, CSf2 n=4, and Mpo n=6). d, Csf1 expression in sorted bone marrow cells of WT and Hcrt−/− mice (n=5 WT; n=6 Hcrt−/−). e, Analysis of mRNA transcript expression in bone marrow leukocytes of Apoe−/− mice after 16 weeks of SF. (for Apoe−/− n=5 except Il10, IL34, CXCL12, CSF3 n=4 and Csf1 n=9; for Apoe−/− SF n=6 except IL5, IL1β, IL6, IL34, CXCL12, CSF3 n=5, IL10 n=5, and Csf1 n=12). f, Blood neutrophils in WTHcrtR1Gfp/Gfp mice over 24 hours (n=3 per group). Data presented as mean ± s.e.m., *p<0.05, **p<0.01,***p<0.001, One-way ANOVA.

