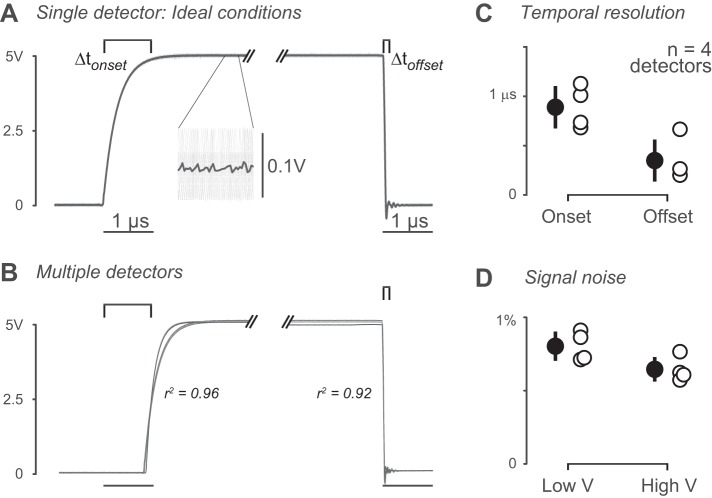
Fig. 3.
Characterization of detectors in ideal conditions. A: example onset and offset curves (Δtonset and Δtoffset, respectively). Low signal = 0 V, high signal = 5 V. Onset is time from 10 to 97% of high signal (0.5 to ~4.88 V). Offset is time from 97% to less than 2% of high signal (4.88 to 0.1 V). Inset shows mean (dark gray) across individual trials (light gray). B: overlaid onset and offset curves of detectors tested in ideal conditions (n = 4). For onset, mean r2 = 0.96 (SD 0.06) (n = 4 detectors, 404 trials). For offset, r2 = 0.92 (SD 0.12) (n = 4 detectors, 404 trials). C: onset and offset time for each detector. Mean onset time = 0.9 (SD 0.21) μs (n = 404 trials, 4 detectors). Mean offset time = 0.35 (SD 0.2) μs (n = 404 trials). D: signal noise for each detector. Mean low signal (0 V) noise = 0.80 (SD 0.10)% (% of high signal, n = 404 trials, 4 detectors). Mean high signal (5 V) noise = 0.65 (SD 0.08)% (n = 404 trials).

