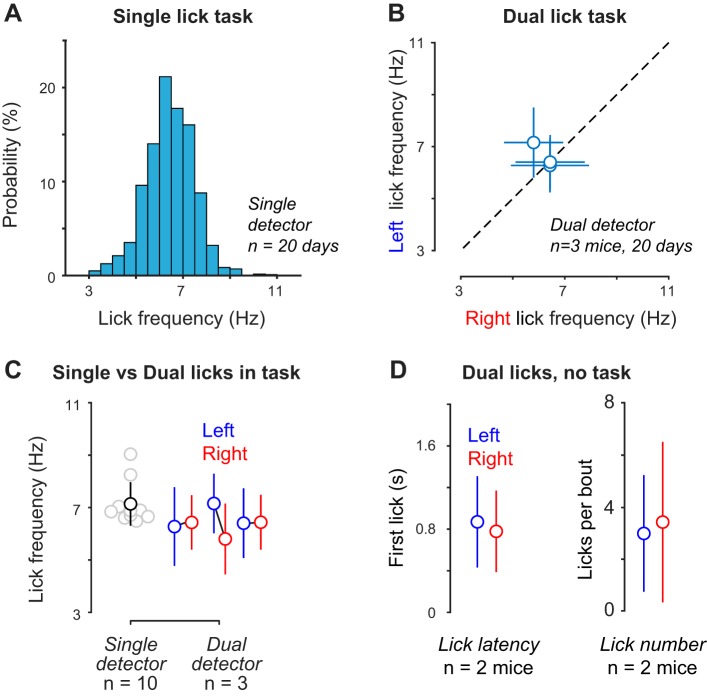
Fig. 6.
Characterization of lick frequency across detectors. A: example distribution of licking frequency for single lick detector during 75 behavioral sessions over 20 days for 1 mouse (n = 8,995 licks). Mean frequency is 6.4 (SD 1.0) Hz. B: comparison of mean licking frequency for left vs. right licking using the same dual detector across 20 days within the same mouse (n = 3 different mice). Means for left vs. right licking were 6.3 (SD 1.5) vs. 6.4 (SD 1.0) Hz, 7.2 (SD 1.1) vs. 5.8 (SD 1.4) Hz, and 6.4 (SD 1.3) vs. 6.4 (SD 1.0) Hz [left vs. right; mean (SD) within mouse]. Data for the three mice were sampled across 20 days each; 59 (SD 11) sessions; 1,179 (SD 734) left lick bouts; 1,204 (SD 732) right lick bouts; 6,609 (SD 4,425) left licks; 6,041 (SD 2,840) right licks. C: comparison of mean lick frequency for dual and single detectors. Single-detector data was sampled from 10 mice using a single-port detector each for 20 days. Single-detector mean is 7.1 (SD 0.83) Hz; n = 10 mice; 34,009 (SD 12,839 licks). Dual-detector data was sampled from 3 mice using the same dual-port detector for 20 days each. Dual-detector means are as in B, left vs. right. D: comparison of dual-lick latency and dual-lick number outside of visual task. No significant difference in either metric for left vs. right licks (n = 2 mice, 120 trials each).

