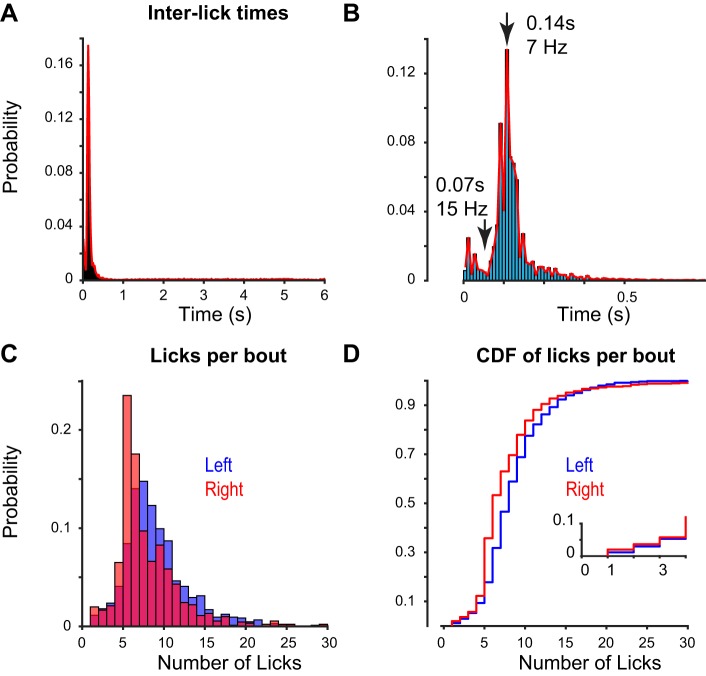
Fig. 7.
Determination of lick bouts and lick frequency within bouts. A: interlick times for all behavioral sessions (n = 24,000 licks; 174 behavioral sessions in 3 mice over 20 days). Time scale is limited to 0–6 s. Behavioral task parameters define interstimulus intervals to fall between 0.5 and 6 s, randomly per trial. Histogram shows >75% of interlick intervals fall below 0.5 s, with no secondary peaks between 0.5 and 6 s. Therefore consecutive licks with intervals <0.5 s were grouped into the same lick bout. B: higher resolution binning of data in A. Local minimum of histogram (0.07 s) defined the upper frequency limit for interlick data within bouts (93% of licks < 15 Hz). C: number of licks per bout following reward delivery during visual task, at left and right detectors. D: cumulative distribution function (CDF) of data in C. Bouts containing 4 or more licks (~95% of data) are considered consummatory lick bouts.

