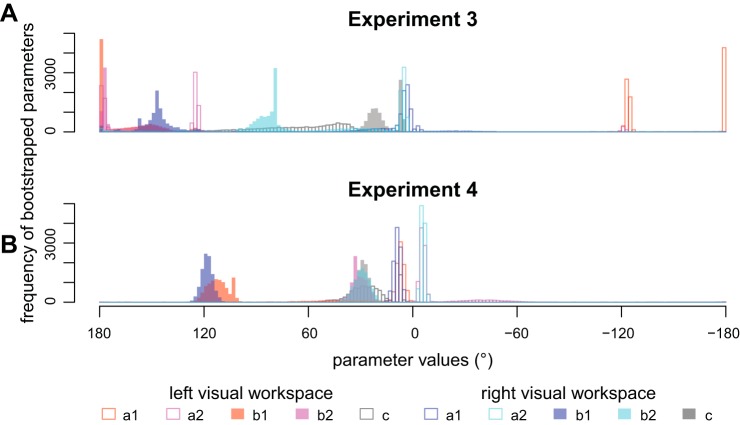
Fig. 6.
Histograms of the bootstrapped parameters for experiment 3 (A) and experiment 4 (B). The distributed and split peaks in A visualize the unstable fit of the bimodal Gaussian to the data of experiment 3. The more confined peaks in B show that the fit is more stable. The centers of generalization (b1, b2) prefer generalization centering on the movement plan rather than the visual target. a, Gain; b, mean; c, standard deviation.

