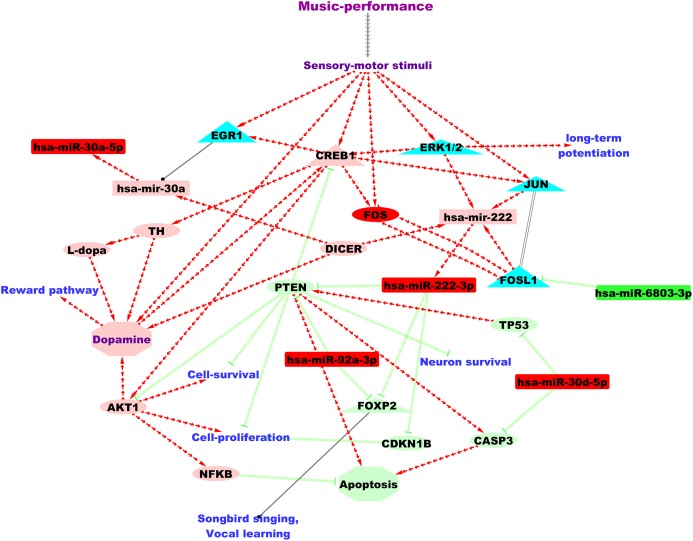
Figure 2. A putative microRNA regulatory network and summary of the findings from the current study based on the analysis of the DE microRNAs.
Green and red colour nodes, respectively, indicate down-regulated and up-regulated microRNAs from our study. Light-green and coral colour nodes denote putative repression and activation, respectively, based on findings from microRNA databases and literature. Annotation for edges: Red separate arrow edges denote activation; green backward slashes indicate repression; solid black edge denotes regulation and parallel lines indicate co-expression. MicroRNAs are represented using rectangles, genes using ellipses and transcriptional regulators using triangles.

