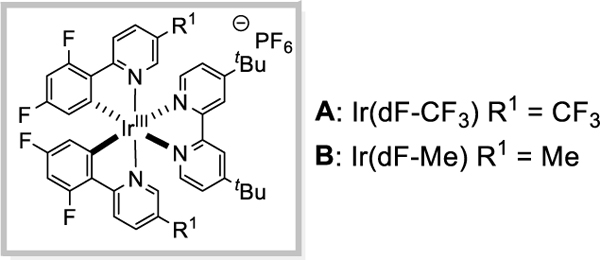
Table 1.
Reaction Optimization
 | |||||
|---|---|---|---|---|---|
| entry | PG | Photocatalyst | R | Base | Yield(%)b |
| 1 | Tf | A | Bn | CS2CO3 | 50 |
| 2 | Tf | A | Bn | K2CO3 | 54 |
| 3 | Tf | A | Bn | K3PO4 | 58 |
| 4 | Tf | B | Bn | K3PO4 | 65 |
| 5 | Tf | A | tBu | quinuclidine | 71 |
| 6 | Tf | B | tBu | quinuclidine | 77 c |
| 7 | COCF3 | B | tBu | quinuclidine | 0 |
| g | Ts | B | tBu | quinuclidine | 0 |
| 9 | Ac | B | tBu | quinuclidine | 0 |
 | |||||
[a]1a (0.1 mmol), alkene (0.15 or 0.3 mmol), base (0.2 mmol), photocatalyst (2.0 mol%), DMF (0.2M), 34 W blue LED, ~ 40 °C, 16h.
[b]Yields determined by 1H NMR using trimethoxybenzene as an internal standard.
[c]Yield of isolated product.
[d]PG = protecting group; Tf = triflyl; Ts = tosyl; Ac = acetyl; DMF = dimethylformamide; Bn = benzyl; tBu = tert-butyl; Et = ethyl; Me = methyl.
