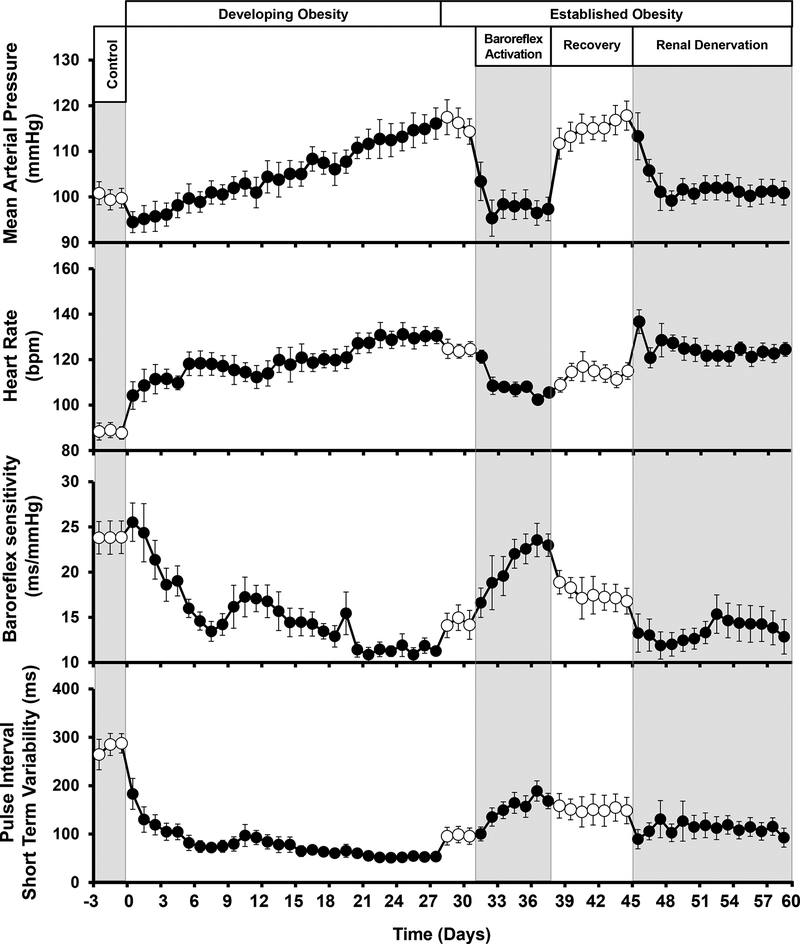
Figure 3.
Changes in mean arterial pressure, heart rate, baroreflex sensitivity and HRV during developing obesity and responses to BA and renal denervation (RDN) after obesity HT was established. Values are means ± SE. During days 1–28, dogs were fed a high fat diet and on day 28 body weight was increased ~ 50%. After day 28, dietary fat was reduced and there were no further changes in body weight for the duration of the study. (Redrawn from R. Iliescu et al. Am J Physiol Cir Physiol. 2013;305:H1080-H1088).

