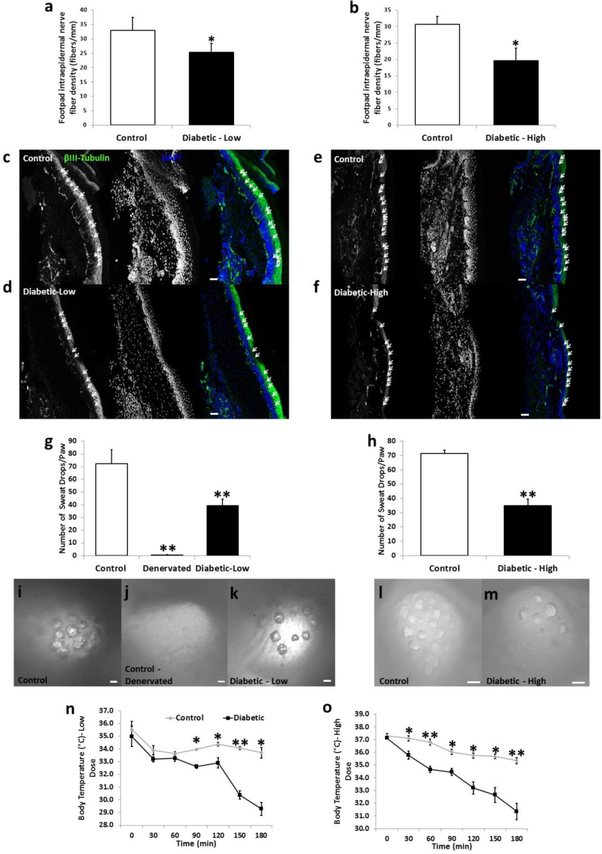
Figure 2.
Morphological and functional changes associated with diabetic sensory and autonomic neuropathy are displayed in low and high dose diabetic mice. Intraepidermal nerve fiber density (fibers/mm) of the hind paw was reduced in low dose (a) and high dose (b) diabetic mice compared to their age-matched controls (n=5/group). Representative images displaying beta-III-tubulin-positive axons crossing into the epidermal layer are shown for control (c,e), low dose (d) and high dose (f) diabetic mice. Arrows indicate fibers counted that projected into the epidermal layer of the hind paw. Pilocarpine-induced sweating was measured using silicone molds on the hind paws of mice. The total number of sweat droplets was counted per hind paw and both low dose (g) and high dose (h) mice displayed significantly impaired sweating compared to control mice (n=10/group). Representative images of sweat droplet imprints into the silicone mold are seen for control (i,l), denervated (control mice in which the saphenous and sciatic nerves were cut; j), low dose (k) and high dose (m) mice. Internal body temperature was measured in 30 min intervals in mice placed at 4°C for low dose (n) and high dose (o) diabetic mice (n = 4–5/group). Nerve fiber density images taken at 20x. Scale bar = 50 μm. Sweat assay images taken at 9x to 20x. Scale bar = 100 μm. * = p < 0.05. ** = p < 0.001.

