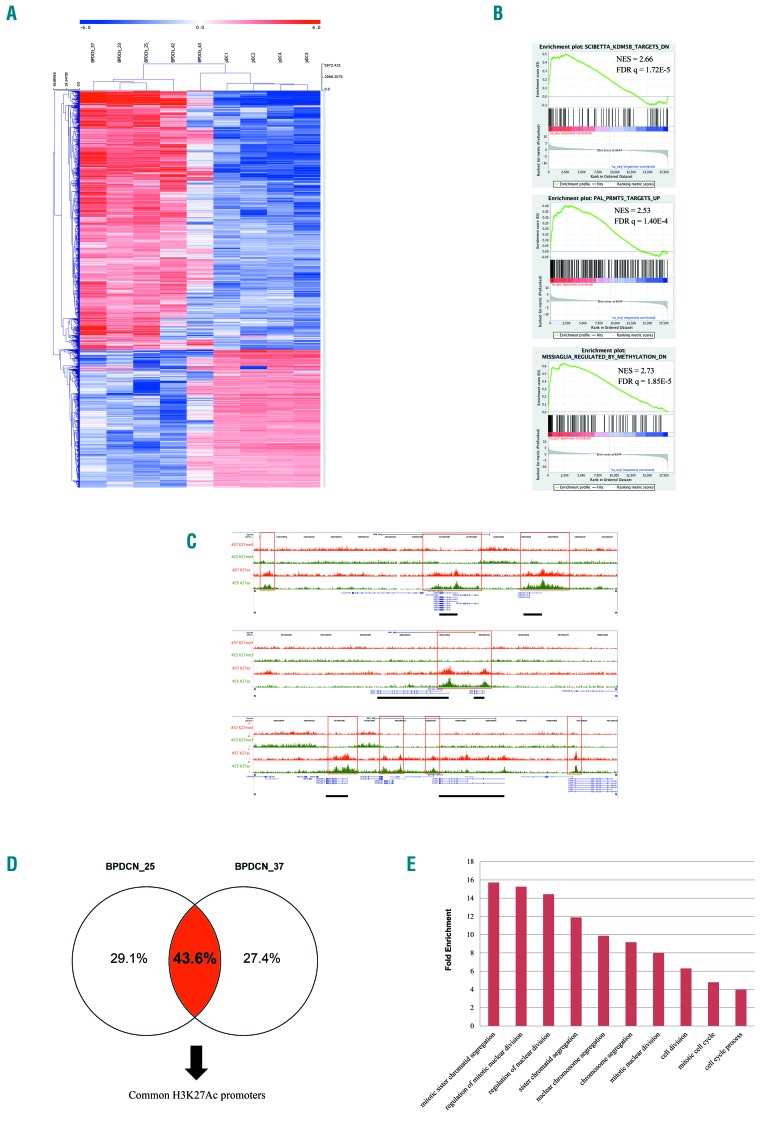
Figure 2.
The transcriptome and H3K27 trymethylation/acetylation profiling of blastic plasmacytoid dendritic cell neoplasm (BPDCN). (A) Unsupervised hierarchical clustering performed on 5 BPDCN samples and 4 plasmacytoid dendritic cell (pDCs) samples according to the expression level of the RNA sequencing data. In the heat-map each row represents a gene and each column a sample. The color scale exemplifies the relative expression level of a gene across all samples: (red) represented genes with an expression level above the mean; (blue) the genes with an expression level lower than the mean. Tumors (BPDCNs) and controls (pDCs) cluster in two distinct groups. (B) Gene Set Enrichment Analysis (GSEA) plot illustrating the enrichment of the KDM5B and PRMT5 gene signatures in BPDCN patients reported in literature34–36 as well as the enrichment of a set of genes, described by Missiaglia et al.37 as responsive to hypomethylating treatment, namely decitabine. Normalized enrichment score (NES) ≥ 2; false discovery rate (FDR) q-value false discovery rate ≤0.0001. (C) Visualization of anti-H3K27ac and anti-H3K27me3 normalized pathology tissue-chromatin immunoprecipitation (PAT-ChIP) sequencing profiles in the UCSC Genome Browser showing genomic regions from patient BPDCN_25 and BPDCN_37. (Red boxes) Exemplificative regions displaying a similar level of anti-H3K27ac in both patients. (Black solid rectangles) Genes in correspondence of the anti-H3K27ac peaks. (D) The cases BPDCN_25 and BPDCN_37 share common H3k27ac regions. (E) Histogram representation of the top 10 significant biological processes emerged by Gene Ontology (GO) analysis of 86 up-regulated genes marked by H3K27ac in their promoters. GO categories are shown in x-axis and the fold enrichment values of observed versus expected genes are reported in the y-axis (FDR q-value <0.001).

