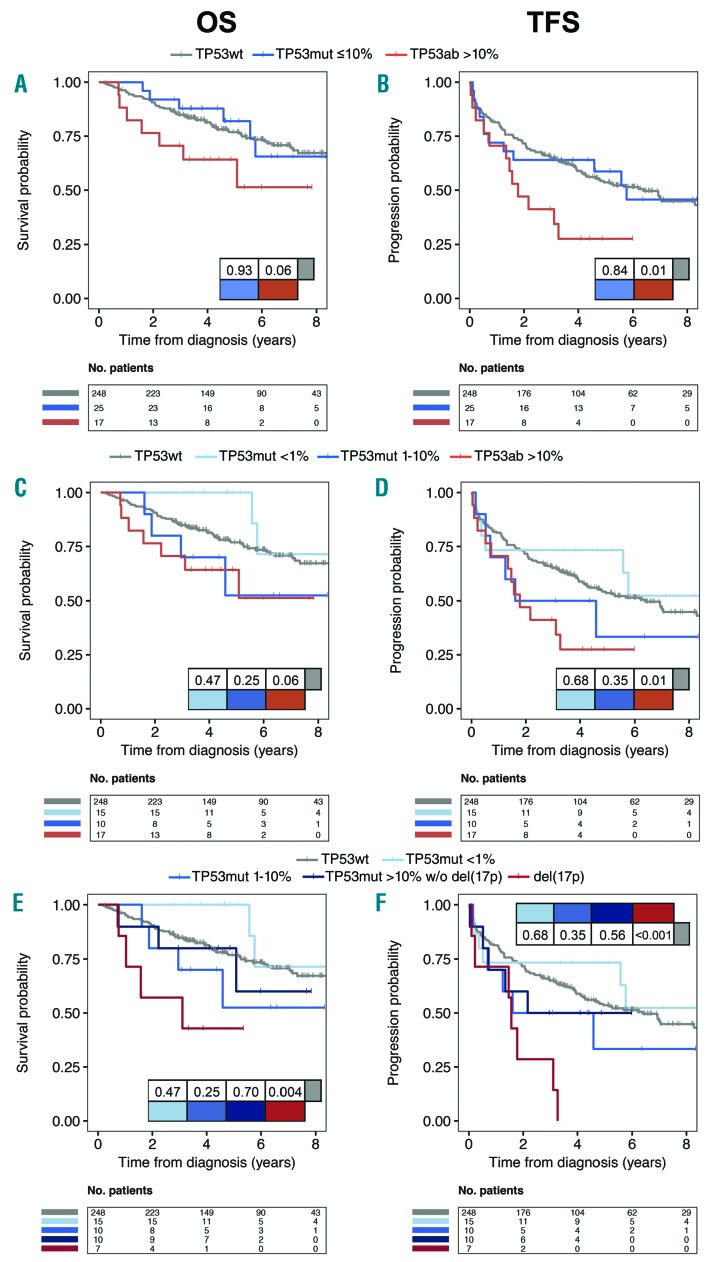
Figure 2.
Overall (OS) and treatment-free survival (TFS) in newly diagnosed patients. Kaplan-Meier curves comparing OS (panels A, C, E) and TFS (panels B, D, F) based on (A and B) TP53 aberrations stratified based on variant allele frequencies (VAF) including del(17p) with 10% cut-off or (C and D) 1% and 10% cutoff. (E and F) Del(17p) and subgroups with TP53 mutations without del(17p) [(TP53mut w/o del(17p)] analyzed separately. P-values are indicated in the tables within the panels.

