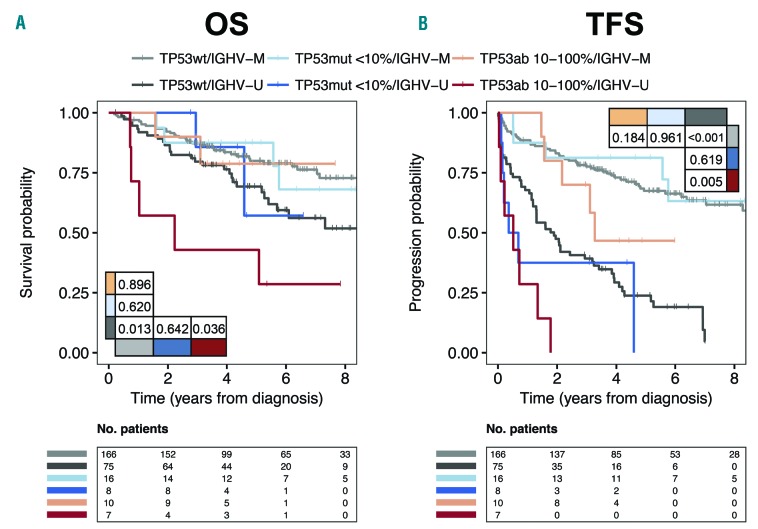
Figure 4.
Stratified analysis in newly diagnosed patients based on TP53 and IGHV status. Kaplan Meier curves for (A) overall survival (OS) and (B) treatment-free survival (TFS) in newly diagnosed patients stratified for IGHV status and for TP53 aberrations based on variant allele frequencies (VAF) ≤10% and >10%. Four and three del(17p) are included for mutated (IGHV-M) and unmutated IGHV (IGHV-U), respectively. P-values indicated in tables within the panels.

