Figure 6.
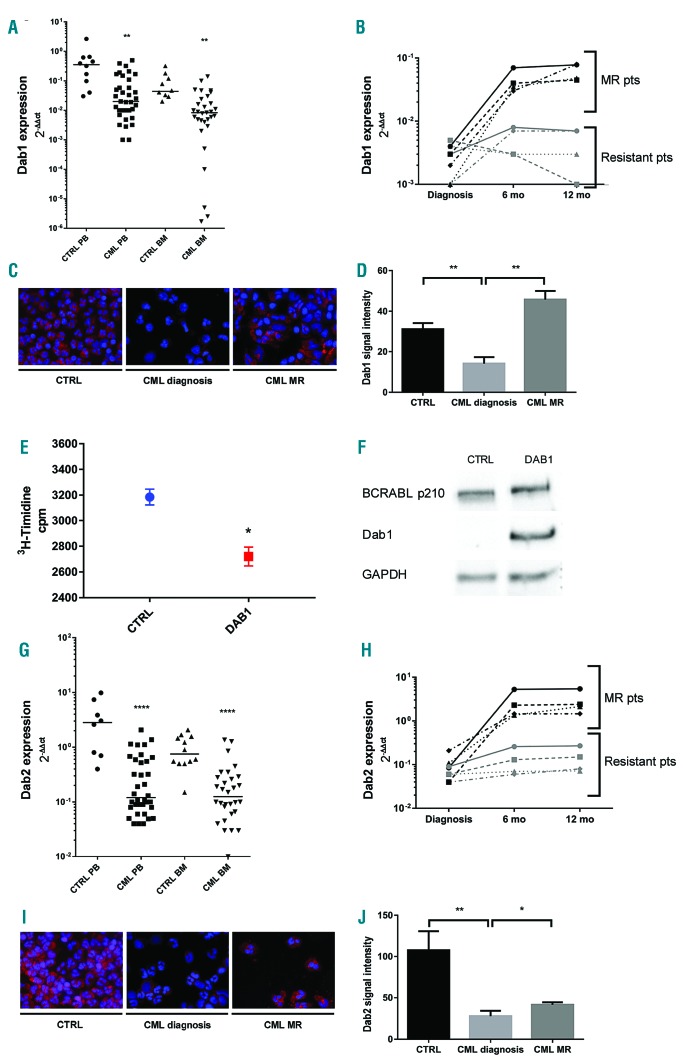
Altered pattern of expression of the human Disabled homologs, Dab1 and Dab2, in patients with chronic myeloid leukemia. (A) Downregulation of Dab1 RNA expression in patients with chronic myeloid leukemia (CML) compared to the expression in healthy donors (CTRL). In particular we found a 1 log reduction of Dab1 expression in both peripheral blood (PB) (P<0.01) and bone marrow (BM) (P<0.01) (median values 2−ΔΔct: 0.02 versus 0.3 in PB and 0.008 versus 0.04 in BM). (B) Expression pattern of Dab1 in CML patients during molecular remission (MR) compared to that in treatment-resistant patients. (C) Immunofluorescence staining of Dab1 protein (red) in PB samples of healthy donors, CML patients at diagnosis and CML patients during MR. Nuclei are stained in blue. (D) Quantification of Dab1 protein expression in the immunofluorescence assay. (E) A 3H-thymidine proliferation assay showing a 20% reduction of cell proliferation in K562 cells transfected with Dab1 plasmid compared to control. (F) Western blot of protein extracts from K562 cells transfected with an empty vector (lane 1) and transfected with a Dab1 expression vector (lane 2), showing detectable expression of Dab1 only in K562 cells transfected with the Dab1 vector. Independent loads of equal amounts of protein extract were probed with antibodies raised against BCR, Dab1 and GAPDH as a loading control. (G) Downregulation of Dab2 RNA expression in CML patients compared to the expression in healthy donors. In particular Dab2 expression was found to be statistically decreased (P<0.0001 and P<0.0001 in PB and BM, respectively) with median values of 0.12 versus 2.8 and 0.12 versus 0.7 in PB and BM, respectively. (H) Pattern of expression of Dab2 in CML patients during MR compared to that in treatment-resistant patients. (I) Immunofluorescence staining of Dab2 protein (red) in PB samples of healthy donors, CML patients at diagnosis and CML patients during MR. Nuclei are stained in blue. (J) Quantification of Dab2 protein expression in an immunofluorescence assay. The statistical comparisons were conducted using a Student t test (*P<0.05, **P<0.01, ****P<0.0001). Bars indicate the standard error.

