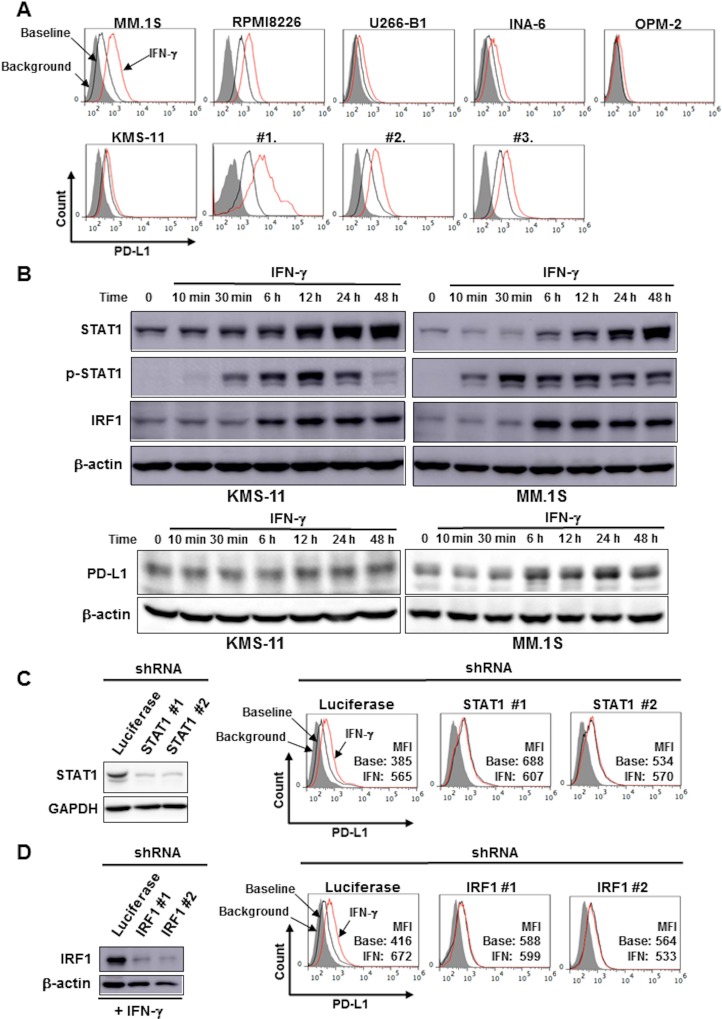
Figure 1. IFN-γ increased PD-L1 expression on MM cells via the STAT1-IRF1 signaling pathway.
(A) Surface expression of PD-L1 on MM cells. MM cell lines as the indicated and primary MM cells (#1, #2, and #3) were cultured in the presence or absence of 100 U/ml of IFN-γ for 24 hours. The surface expression of PD-L1 was then analyzed by flow cytometry. (B) Activation of the STAT1-IRF1 pathway. After overnight starvation in culture media containing 1% FBS, KMS-11 and MM.1S cells were incubated in the presence of IFN-γ (100 U/ml) for the indicated time periods. The cells were then harvested, and STAT1, tyrosine-phosphorylated STAT1 (p-STAT1), IRF1 and PD-L1 protein levels were examined by Western blot analysis. β-actin were blotted as loading controls. Effects of STAT1 (C) and IRF1 (D) gene silencing on PD-L1 expression. STAT1 gene expression was silenced using shRNA in KMS-11 cells. (C) STAT1 shRNA (clones #1 and #2) or control Luciferase shRNA were transfected into KMS-11 cells. The knockdown efficacy was examined by Western blot analysis (left). GAPDH was blotted as loading control. PD-L1 expression on the cells was analyzed by flow cytometry after incubating for 24 hours in the presence or absence of 100 U/ml of IFN-γ. (D) IRF1 shRNA (clones #1 and #2) or control Luciferase shRNA were transfected into KMS-11 cells. The knockdown efficacy was examined by Western blot analysis after incubating for 12 hours in the presence of 100 U/ml of IFN-γ. (left). β-actin were blotted as loading controls. PD-L1 expression on the cells was analyzed by flow cytometry after incubating for 24 hours in the presence or absence of 100 U/ml of IFN-γ. Gray areas indicate background staining with isotype controls. Mean fluorescence intensity (MFI) of PD-L1 is shown. Base, baseline; IFN, IFN-γ.

