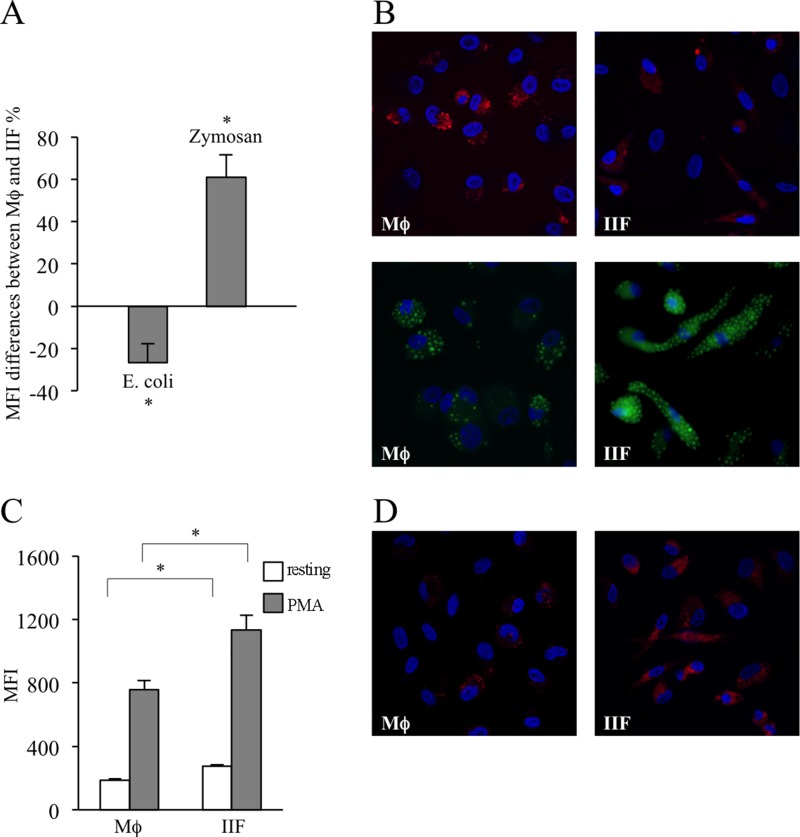
Figure 6. Evaluation of phagocytic ability and ROS production in differentiated cells.
The results have been evaluated in flow-cytometry and expressed as MFI and by fluorescence microscopy. They are mean ± SD and are representative of 3 experiments. (A) Mϕ and IIF were exposed to E. coli particles or zymosan labelled with a pH-sensitive fluorophore. MFI differences between macrophages and fibrocytes, expressed as percentages, are shown. In each condition autofluorescence was subtracted. *p < 0.05. (B) Fluorescence microscopy of Mϕ (upper left and lower left) and IIF (upper right and lower right) incubated with E. coli particles (upper panels) or zymosan (lower panels). (C) Mϕ and IIF were incubated with CellRox Deep Red reagent, both in basal condition (resting) and after stimulation with PMA. In each condition autofluorescence was subtracted. *p < 0.001. (D) Fluorescence microscopy of resting Mϕ (left panel) and IIF (right panel) incubated with CellRox Deep Red reagent.

