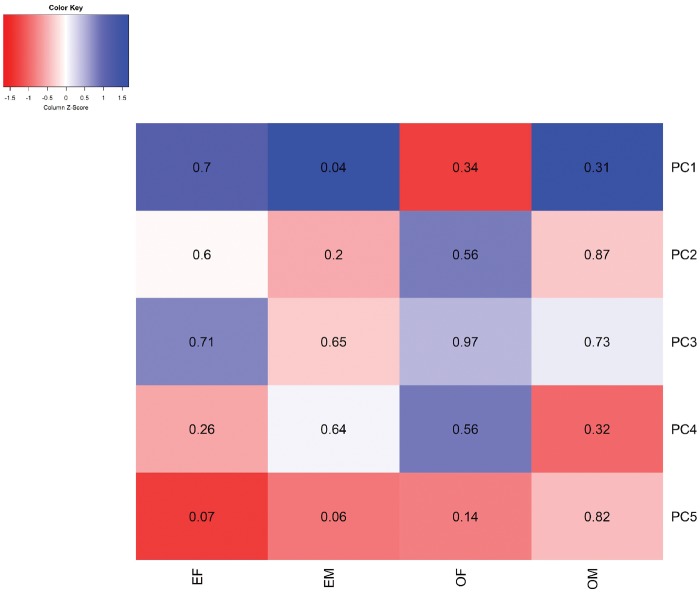
Figure 4.
Heatmap of associations between SEP indicators and principal components of cord blood DNA methylation. The heatmap depicts the estimates of associations, represented by shades, and corresponding P-values, displayed as numbers, between the four SEP indicators and the first five principal components of cord blood DNA methylation. Models were adjusted for birthweight, parity, gestational age and sex of the newborn in addition to technical variables: bead array row and bisulphite conversion batch. EF, education of the father; EM, education of the mother; OF, occupation of the father; OM, occupation of the mother.

