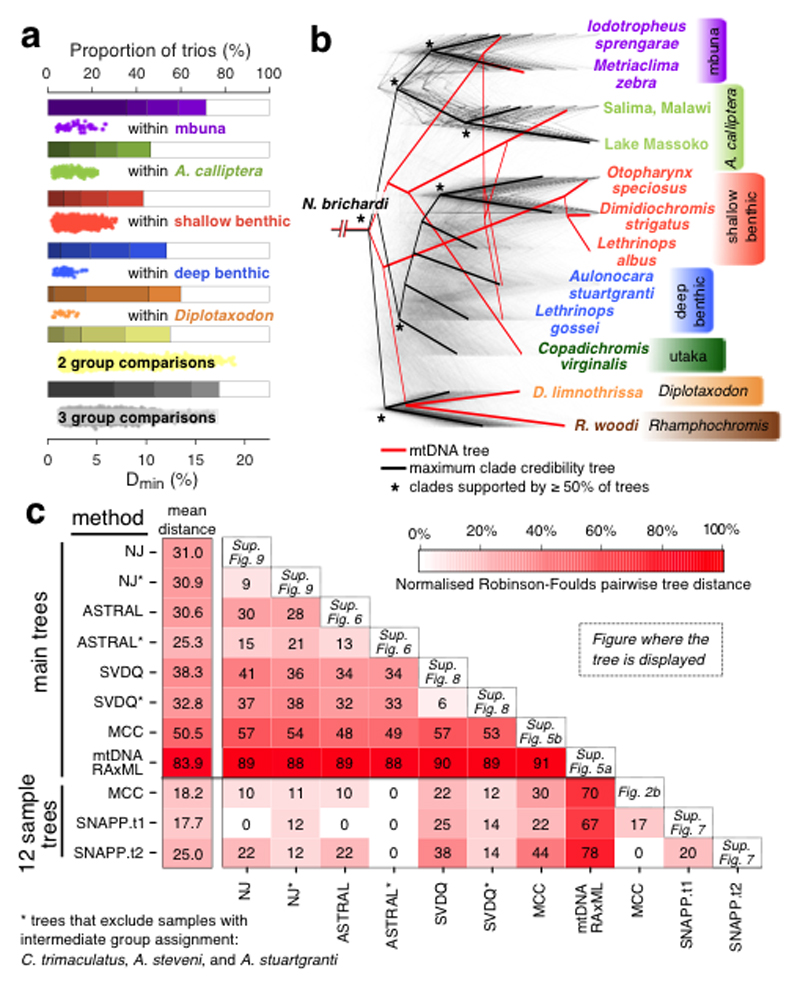
Fig. 2. Excess allele sharing and patterns of species relatedness.
a, Derived allele sharing reveals non-tree-like relationships among trios of species. The bars show the proportion of significantly elevated Dmin scores (see main text). Shading corresponds to FWER q values of (from light to dark) 10-2, 10-4, 10-8, 10-14. The scatterplots show the Dmin scores that were significant at FWER<0.01. Results are shown separately for comparisons where all three species in the trio are from the same group, and for cases where the species come from two or three different groups. Rhamphochromis and utaka within-group comparisons are not shown due to the low number of data points. b, A set of 2543 Maximum Likelihood (ML) phylogenetic trees for non-overlapping regions along the genome. Branch lengths were scaled for visualization so that the total height of each tree is the same. The local trees were built with 71 species and then subsampled for display to 12 individuals representing the eco-morphological groups. The maximum clade credibility tree shown here was built from the subsampled local trees. A ML mitochondrial phylogeny is shown for comparison. c, A summary of all phylogenies from this study and the normalised Robinson-Foulds distances between them, reflecting the topological distance between pairs of trees on the scale from zero to 100%. The least controversial 12 sample tree is SNAPP.t1, with an average distance to other trees of 17.7%, while ASTRAL* is the least controversial among the ‘main trees’ (mean distance of 25.3%). To compare trees with differing sets of taxa, the trees were downsampled so that only matching taxa were present. The position of the outgroup/root was considered in all comparisons.

