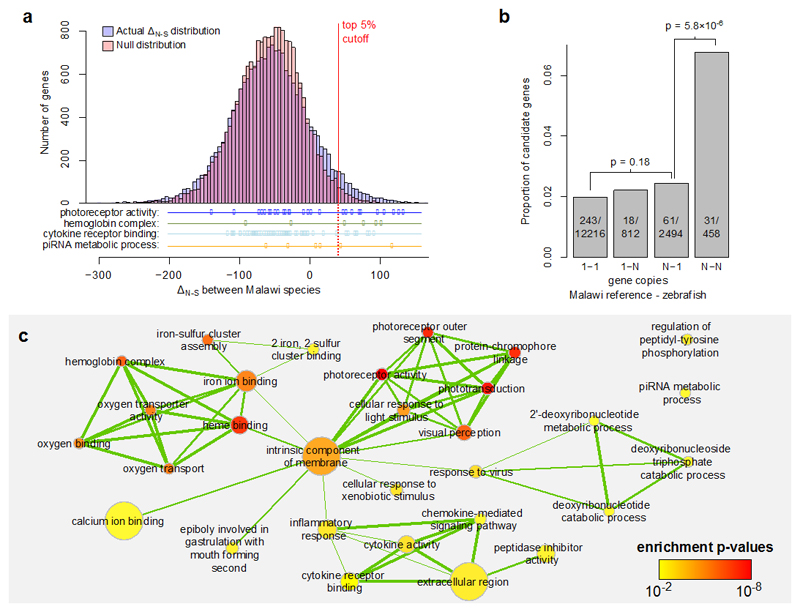
Fig. 5. Gene selection scores, copy numbers, and ontology enrichment.
a, The distribution of the non-synonymous variation excess scores (ΔN−S) highlighting the top 5% cutoff, compared against a null model. The null was derived by calculating the statistic on randomly sampled combinations of codons. We also show the distributions of genes in selected Gene Ontology (GO) categories which are overrepresented in the top 5%. b, The relationship between the probability of ΔN−S being in the top 5% and the relative copy numbers of genes in the Lake Malawi reference (M. zebra) and zebrafish. The p-values are based on χ2 tests of independence. Genes existing in two or more copies in both zebrafish and Malawi cichlids are disproportionately represented among candidate selected genes. c, An enrichment map for significantly enriched GO terms (cutoff at p ≤ 0.01). The level of overlap between GO enriched terms is indicated by the thickness of the edge between them. The colour of each node indicates the p-value for the term and the size of the node is proportional to the number of genes annotated with that GO category.

