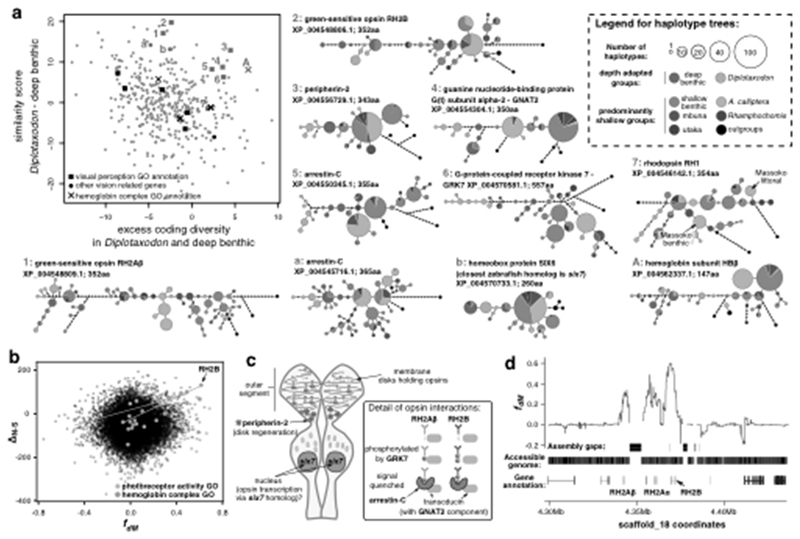
Fig. 6. Shared selection between the deep water adapted groups Diplotaxodon and deep benthic.
a, The scatterplot shows the distribution of genes with high ΔN−S scores (candidates for positive selection) along axes reflecting shared selection signatures. Only genes with zebrafish homologs are shown. Amino acid haplotype trees, shown for genes as indicated by the red symbols and numbers, indicate that Diplotaxodon and deep benthic species are often divergent from other taxa, but similar to each other. Outgroups include Oreochromis niloticus, Neolamprologus brichardi, Astatotilapia burtoni, and Pundamilia nyererei. b, Selection scores plotted against fdM (mbuna, deep benthic, Diplotaxodon, N. brichardi), a measure of local excess allele sharing between deep benthic and Diplotaxodon. Overall there is no correlation between ΔN−S and fdM. However, the strong correlation between ΔN−S and fdM in the highlighted GO categories suggests that positively selected alleles in those categories tend to be subject to introgression or convergent selection between Diplotaxodon and the deep benthic group. c, A schematic drawing of a double cone photoreceptor expressing the green sensitive opsins and illustrating the functions of other genes with signatures of shared selection. d, fdM calculated in sliding windows of 100 SNPs around the green opsin cluster, revealing that excess allele sharing between deep benthic and Diplotaxodon extends far beyond the coding sequences.

