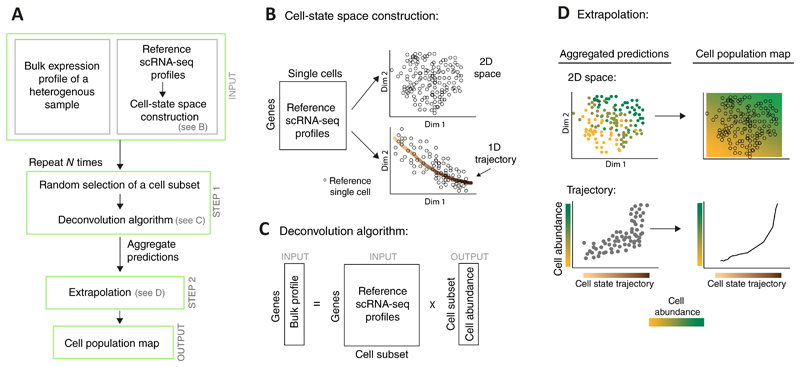
Figure 1. Overview of the CPM algorithm.
A flowchart of the CPM pipeline (A) with illustrations of specific steps (B-D). The prior (reference) knowledge consists of single-cell RNA-seq profiles (derived from one or a few individuals) together with their associated cell-state space structure (A, top); such space may be constructed either through dimension reduction (e.g., a two-dimensional space in B, top) or through further identification of a well-defined cell trajectory (e.g., a "one-dimensional space" in B, bottom). Given a bulk expression profile of a complex tissue, CPM utilizes a deconvolution approach to infer the quantity of each reference cell (A middle, C) and then extrapolates these predictions over the entire cell-state space, thereby providing the output 'cell population map' (A bottom, D). To avoid simultaneous deconvolution with a very large number of reference profiles, deconvolution is applied N times on subsets of the reference profiles, and the inferred quantities are then aggregated.

