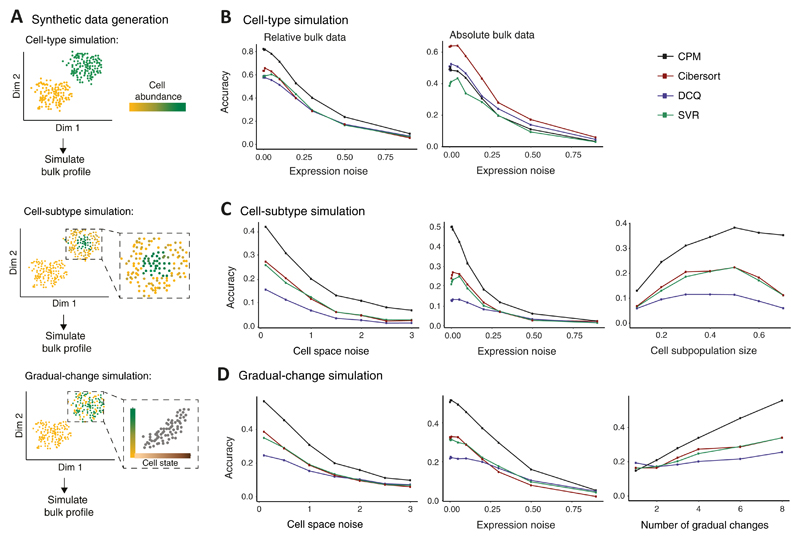
Figure 2. Performance assessed via synthetic data.
(A) Synthetic data were generated either by changes of cell percentage in discrete cell types ('cell-type simulation', top); by changes of cell percentage in cell subtypes, within cell types ('cell-subtype simulation', middle); or by gradual changes in cell percentage along a trajectory of cell states ('gradual-change simulation', bottom). Illustration and abbreviation are as in Fig. 1. (B−D) Accuracy of inferring cell abundance for the three simulation types: cell-type simulation (B), cell-subtype simulation (C), and the gradual-change simulation (D). Accuracy (y axis) is defined as the Pearson correlation coefficient between predicted and true cell abundance and is shown across varying data parameters (x axis) for alternative deconvolution methods (colour coded). Results are shown for bulk relative profiles (B left, C and D) or absolute profiles (B right). The alternative methods were applied with a reference dataset that was generated using granularity of 4 cell groups.

