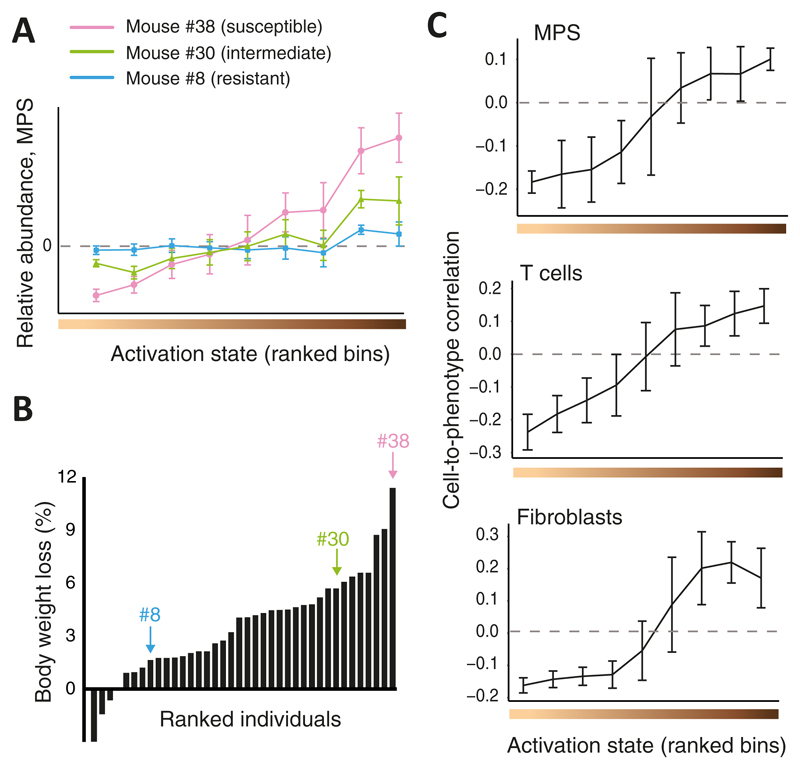
Figure 3. Cellular heterogeneity during in-vivo influenza virus infection, reconstructed by CPM.
(A) Shown are CPM-inferred relative MPS abundance values (y axis), averaged over cells from each activation state bin (bins were ranked with increasing activation states from left to right; x axis), for three representative infected individuals (colour coded). n=103 cells; error bars, standard deviation. (B) Percentages of measured body weight loss (y axis) of 38 infected individuals, ranked by disease severity (x axis). Marked individuals are the three shown in A. (C) Cell-to-phenotype Pearson correlation coefficients across the 38 infected CC mice (y axis), averaged by activation state bins (x axis), presented for MPS cells (top, 103 cells), T cells (middle, 378 cells) and fibroblasts (bottom, 375 cells). Error bars, standard deviations.

