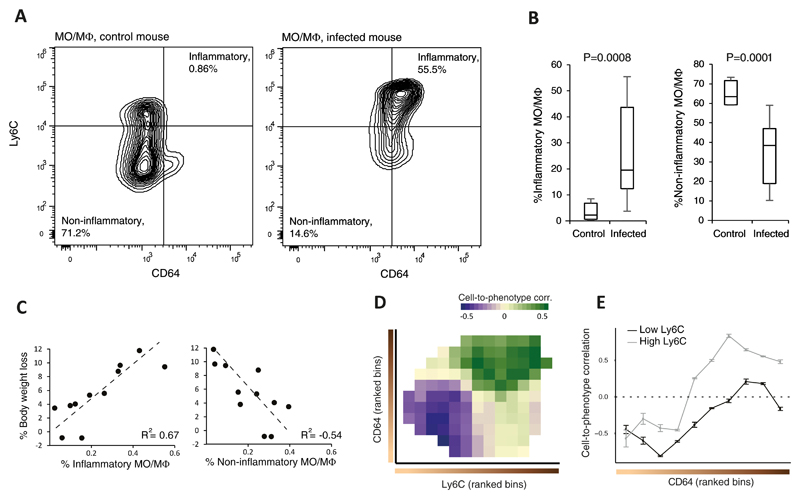
Figure 4. Confirmation of gradual changes in relationships of cells to physiology over a trajectory of cell-activation states.
Flow cytometry analyses of lung-derived MO/MΦs, stained for CD64 and Ly6C activation markers; cell percentages were calculated relative to the entire population of lung MO/MΦs. (A) Shown are representative analyses of control (left) and infected (right) animals (CC line 5001A). Statistics for the remaining individuals is shown in B. (B) Box plots showing the percentages of inflammatory MO/MΦs (CD64+Ly6C+; left) and non-inflammatory MO/MΦs (CD64-Ly6C- ;right) in 11 infected and 5 control CC animals. Boxes represent the 25th, 50th and 75th percentiles; whiskers show maxima and minima. P-values are indicated, one-sided t-test. (C) Shown are percentages of body weight loss of infected individual mice (y axis) as a function of their percentage of inflammatory (left) and non-inflammatory (right) MO/MΦs (x axis). (D) Shown are cell-to-phenotype correlation coefficients (calculated across the infected mice), binned and ranked according to the levels of the activation markers (CD64, y axis; Ly6C, x axis) and colour-coded in each bin. (E) Cross sections of the 2-dimensional map in D. Data are mean ± stdev across n=100 bootstrapped samples.

