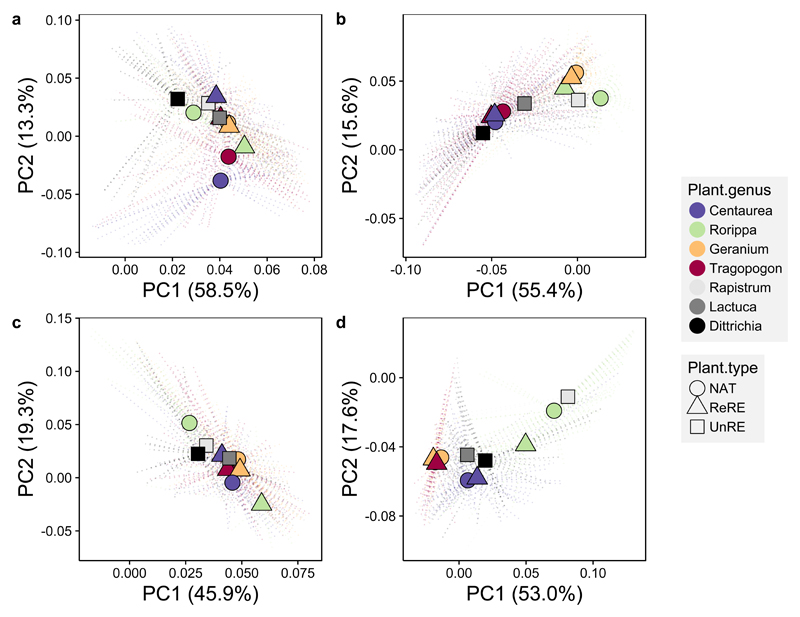
Figure 3. Plant species was the strongest predictor of bacterial (top) and fungal (bottom) community structure in both the soil (left) and the rhizosphere (right).
PCoA ordinations show the centroid of all individuals for each plant species with lines representing connections to individual samples (not plotted). Plant group (native, related range expander and unrelated range expander) is represented by shape, and plant genus by color.

