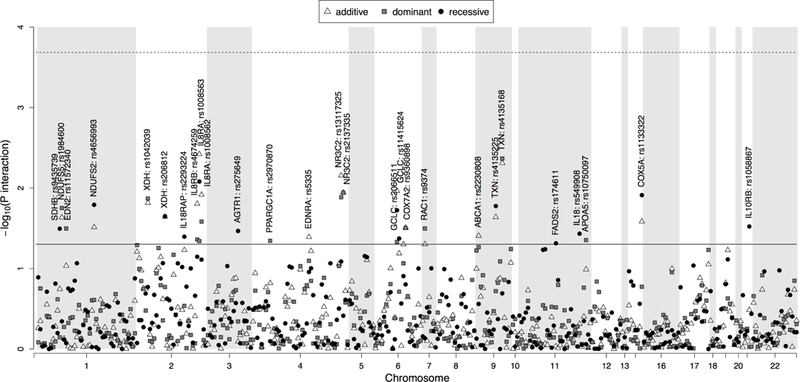
Figure 2. Candidate genes-arsenic interaction –log10 P-values.

P-values for 354 SNPs derived from linear regression models (dominant, recessive and additive model) adjusted for age, sex, education, urine cotinine levels, smoking status, alcohol consumption, fish consumption, residence place and log-transformed arsenobetaine, are presented on the left Y axis on the logarithmic scale according to the position of the SNPs on chromosome (X axis). The horizontal solid line corresponds to a nominal p-value of significance equal to 0.05. Horizontal dashed line corresponds the effective SNP number corrected p-value equal to 0.0002.
