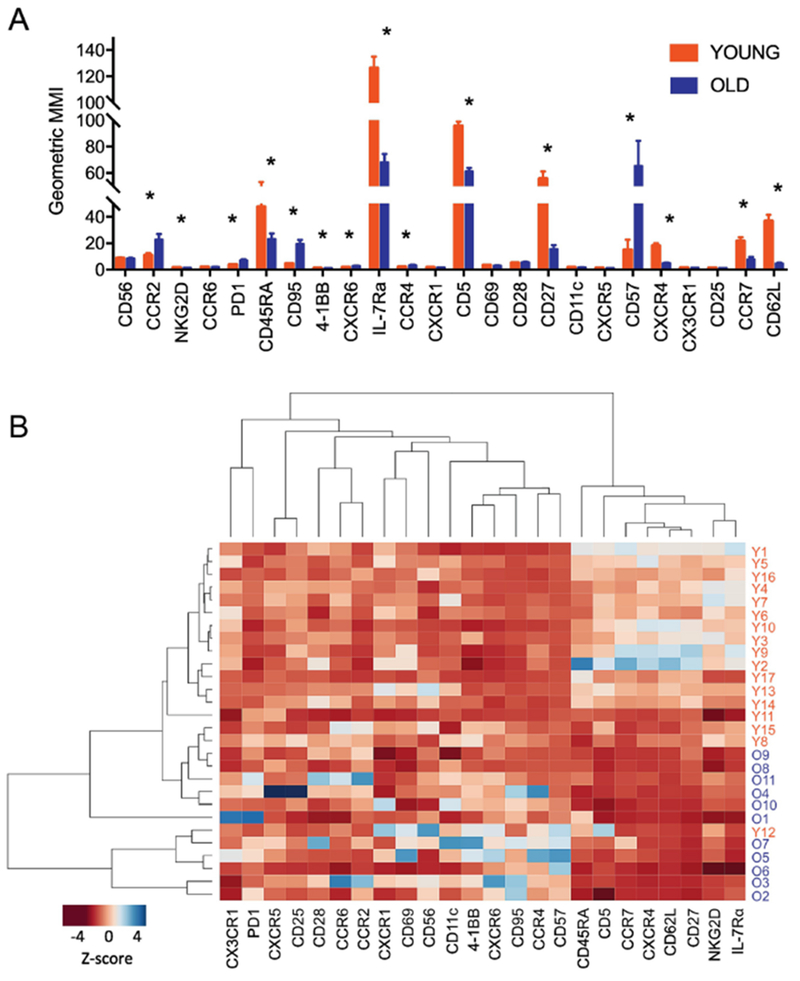
Fig.1. A set of molecules expressed by CD8+ T cells alter with age, resulting in the clustering of young and older adults by an unbiased analysis.
PBMCs of young and older adults were stained with antibodies to a set of molecules (Table S2) and run on a Helios CyTOF instrument. The acquired data were normalized and analyzed using FlowJo software. (A) Geometric mean metal expression intensities (GMMI) of individual molecules in CD8+ T cells of young and older adults (n = 17 and 11, respectively). *q < 0.05 by the t-test with multiple comparison control (false discovery rate or FDR, 5%). Bars and error bars indicate mean and standard error of mean (SEM). (B) Heatmap showing the results of an unbiased hierarchical clustering analysis of molecule and studied subjects based on the z-scores of GMMI of individual molecules.

