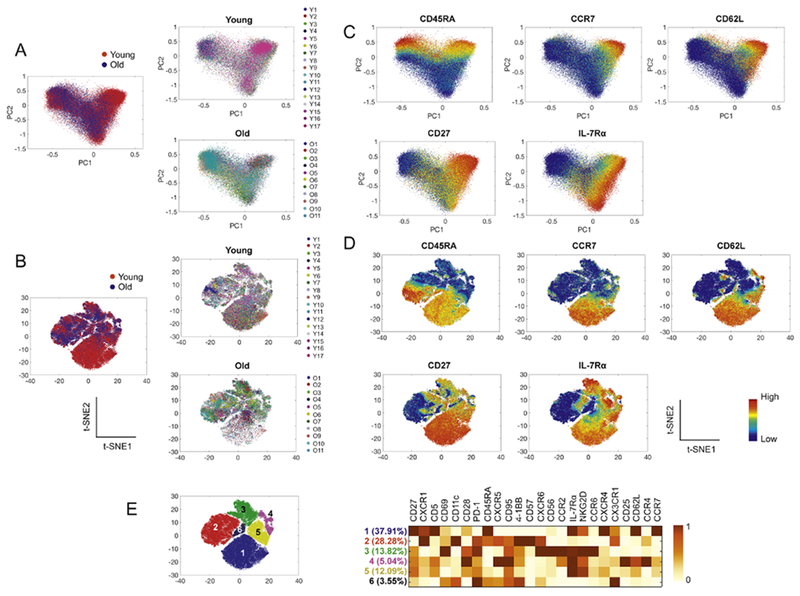
Fig. 2. Multidimensional characteristics of CD8+ T cells alter with age as visualized by the dimensionality reduction analysis tools PCA and t-SNE.
CD8+ T cells gated from the acquired CyTOF data in Fig 1 were analyzed using PCA and t-SNE. (A-B) The relationships of CD8+ T cells from 17 young and 11 older adults were visualized on PCA (A) and t-SNE (B) plots based on the expression of 24 molecules (see Fig. 1A). (C-D) The expression of the indicated molecules on PCA and t-SNE plots is shown. (E) Heatmap shows the mean expression levels of individual molecules in the cell subsets indicated by the numbers in the t-SNE plot.

