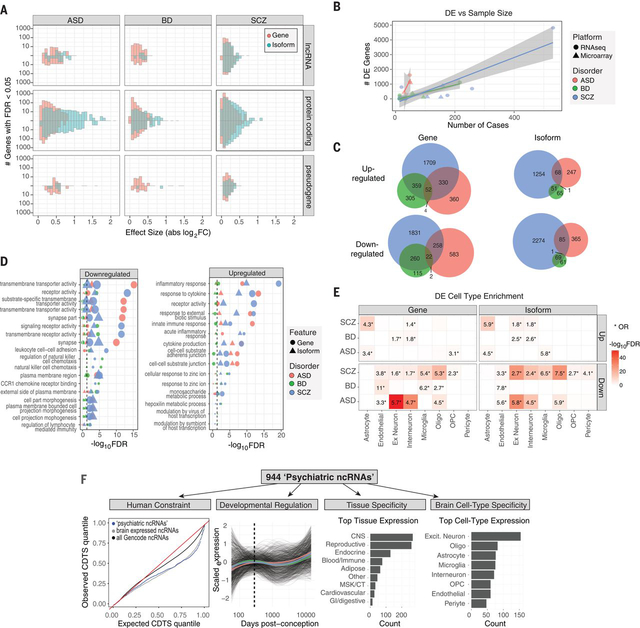
Figure 1. Gene and isoform expression dysregulation in psychiatric brain.
A) Differential expression effect size (|log2FC|) histograms are shown for protein-coding, lncRNA, and pseudogene biotypes up or downregulated (FDR<0.05) in disease. Isoform-level changes (DTE; blue) show larger effect sizes than at gene level (DGE; red), particularly for protein-coding biotypes in ASD and SCZ. B) A literature-based comparison shows that the number of DE genes detected is dependent on study sample size for each disorder. C) Venn diagrams depict overlap among up or downregulated genes and isoforms across disorders. D) Gene ontology enrichments are shown for differentially expressed genes or isoforms. The top 5 pathways are shown for each disorder. E) Heatmap depicting cell type specificity of enrichment signals. Differentially expressed features show substantial enrichment for known CNS cell type markers, defined at the gene level from single cell RNA-Seq. F) Annotation of 944 unique non-coding RNAs DE in at least one disorder. From left to right: Sequence-based characterization of ncRNAs for measures of human selective constraint; brain developmental expression trajectories are similar across each disorder (colored lines represent mean trajectory across disorders); tissue, and CNS cell type expression patterns.

