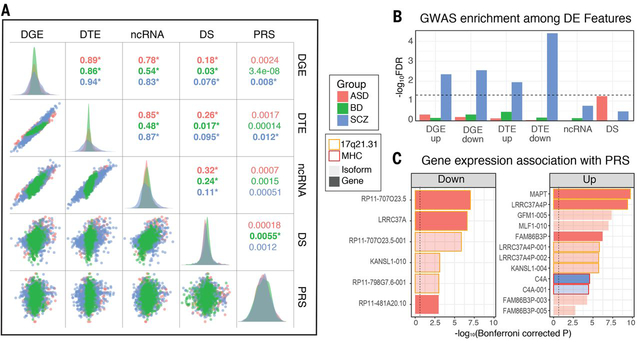
Figure 3. Overlaps and genetic enrichment among dysregulated transcriptomic features.
A) Scatterplots demonstrate overlap among dysregulated transcriptomic features, summarized by their first principle component across subjects (R2 values; *P<0.05). Polygenic risk scores (PRS) show greatest association with differential transcript signal in SCZ. B) SNP-heritability in SCZ is enriched among multiple differentially expressed transcriptomic features, with downregulated isoforms showing most substantial association via stratified LD-score regression. C) Several individual genes and isoforms exhibit genome-wide significant associations with disease PRS. Plots are split by direction of association with increasing PRS. In ASD, most associations localize to the 17q21.31 locus, harboring a common inversion polymorphism. In SCZ, a significant association as observed with C4A in the MHC locus.

