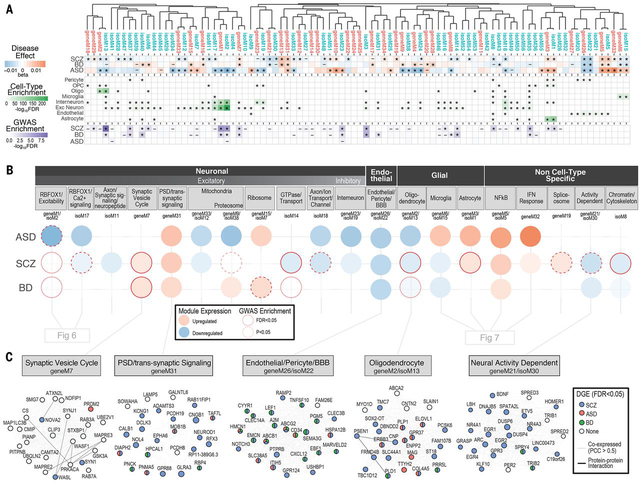
Figure 5. Gene and isoform co-expression networks capture shared and disease-specific cellular processes and interactions.
A) Gene and isoform co-expression networks demonstrate pervasive dysregulation across psychiatric disorders. Hierarchical clustering shows that separate gene- and isoform-based networks are highly overlapping, with greater specificity conferred at the isoform level. Disease associations are shown for each module (linear regression β value, * FDR<0.05, – P<0.05). Module cell type enrichments (*FDR<0.05) are shown for major CNS cell types defined from PsychENCODE UMI single cell clusters. Enrichments are shown for GWAS results from SCZ (59), BD (90), and ASD (38), using stratified LD score regression (* FDR<0.05, – P<0.05). B) Co-expression modules capture specific cellular identities and biological pathways. Colored circles represent module differential expression effect size in disease, with red outline representing GWAS enrichment in that disorder. Modules are organized and labeled based on CNS cell type and top gene ontology enrichments. C) Examples of specific modules dysregulated across disorders, with top 25 hub genes shown. Edges represent co-expression (Pearson correlation > 0.5) and known protein-protein interactions. Nodes are colored to represent disorders in which that gene is differentially expressed (*FDR<0.05).

