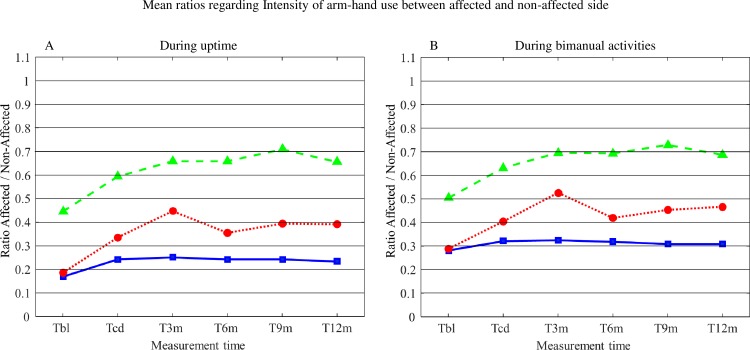
Fig 6.
A: Mean ratios regarding Intensity of arm-hand use between the affected and the non-affected arm-hand during uptime for subgroups 1, 2 and 3. B: Mean ratios regarding Intensity of arm-hand use between the affected and the non-affected arm-hand during bimanual activities for subgroups 1, 2 and 3. T = time; bl = baseline; cd = clinical discharge; m = month; A = affected side; NA = non-affected side. Solid line = subgroup 1; Dotted line = subgroup 2; Dashed line = subgroup 3.

