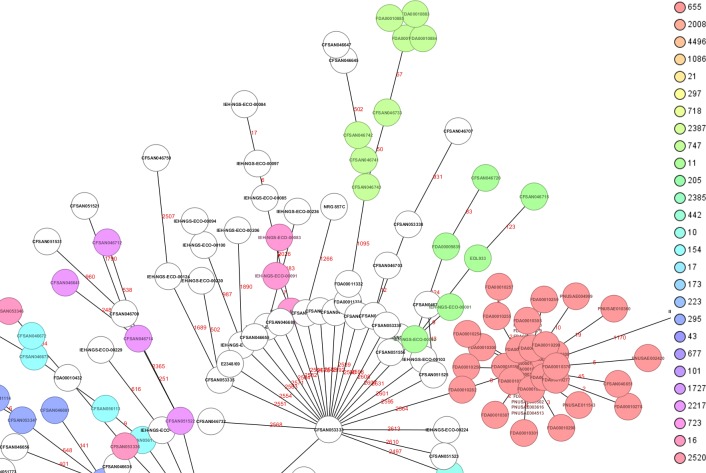
Fig 2. View of a segment from the minimum spanning tree (MST) showing the relationships among all different STECs (complete MST in S1 Fig).
The numbers above the connected lines (not to scale) represent allele differences between strains belonging to the same ST. The isolates are colored based on different STs as labeled.

