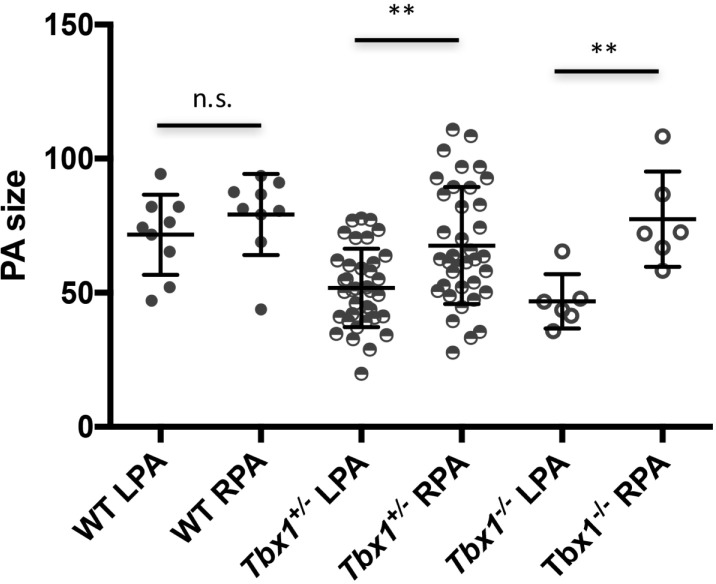
Fig 1. Pulmonary artery size in mouse fetuses.
Distribution of pulmonary arteries measurements in WT, Tbx1+/-, and Tbx1-/- fetuses at E18.5. n.s.: not significant; **: P value < 0.005, Mann-Whitney test. The data source used to generate this graph is in the Supporting Information Table 1.

