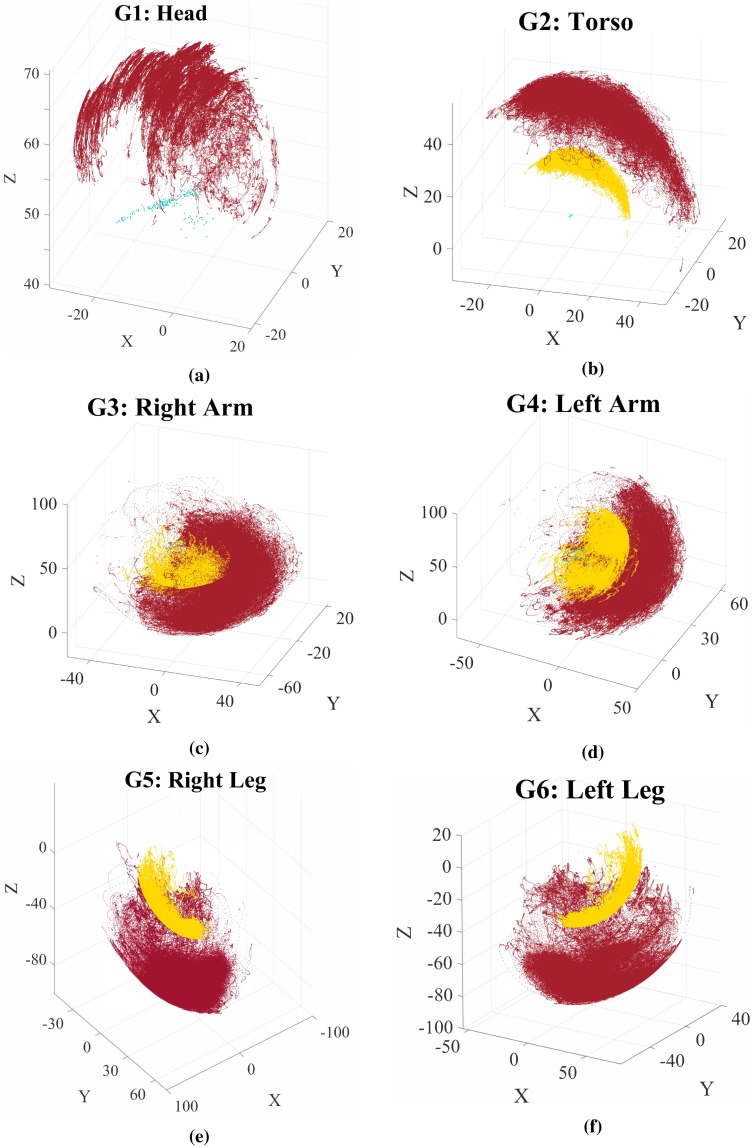
Fig 3. Sequences of joint positions, for each skeleton group, after the root-sequence normalization described in Section 3.
Position data are in cm. The green points show the most internal group joint data (e.g. the hip for the leg); the yellow points show the intermediate group joint data (e.g. the knee for the leg); the red points show the most external group joint data (e.g. the ankle for the leg). The joints data are collected from the datasets described in Section 6.

