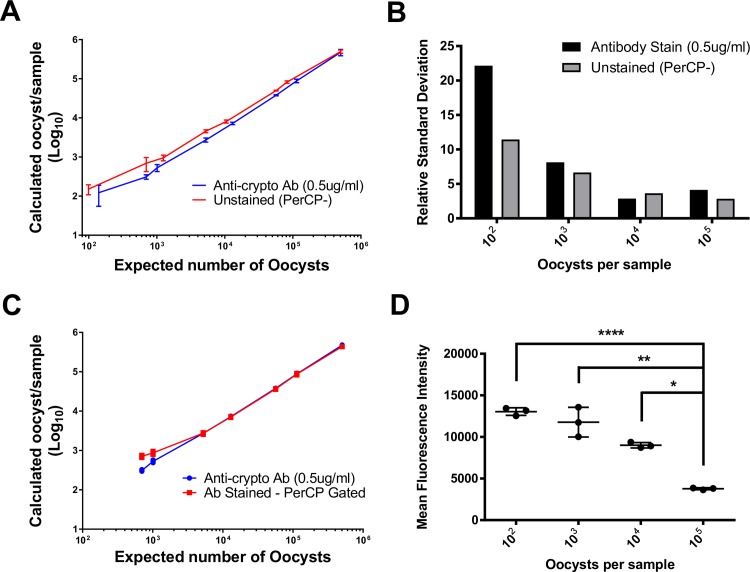
Fig 3. Comparison of antibody staining procedure and proposed PerCP gating strategy.
(A) The counted number prepared for each sample versus the number of oocysts from each gating method. Antibody staining method (blue); unstained PerCP gating strategy (red). (B) Relative standard deviation from the antibody staining and unstained method. (C) Graph of calculated number of oocysts per sample using the antibody staining method and the PerCP gating strategy applied to stained samples. (D) Mean fluorescence intensity for oocysts stained with 0.5 μg/ml monoclonal antibody. Error bars indicate one standard deviation from the mean. * (p < 0.05); ** (p < 0.01); **** (p < 0.0001).

