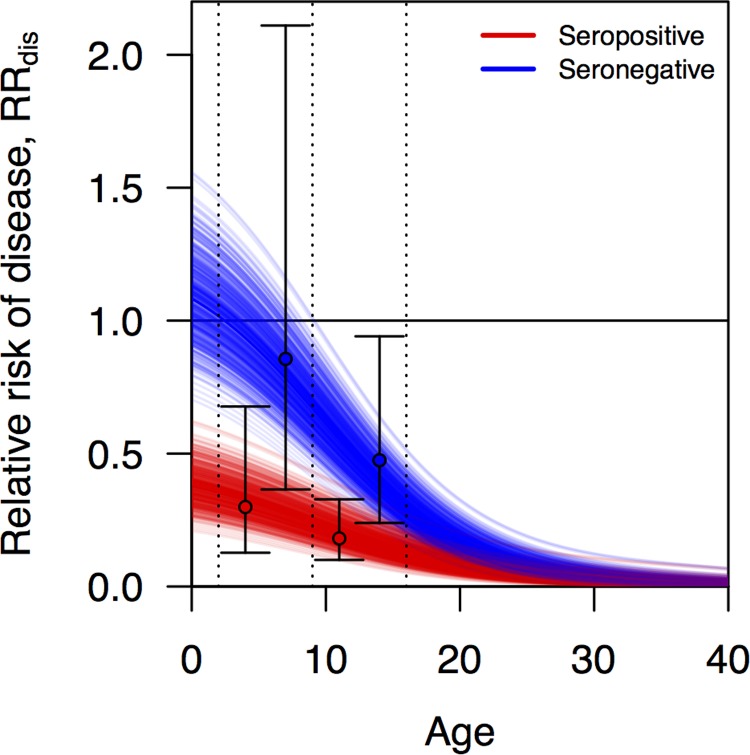
Fig 2. Relative risk of disease, RRdis, as a function of age and serostatus (blue: seronegative, red: seropositive) estimated from vaccine trial data [16].
Each line represents a distinct random draw from the distribution of these relationships. Black circles correspond to point estimates of relative risk of disease in the trial for a given age group (2–9 left, 9–16 right) and serostatus (red vs. blue), and error bars indicate 95% confidence intervals around those estimates.

