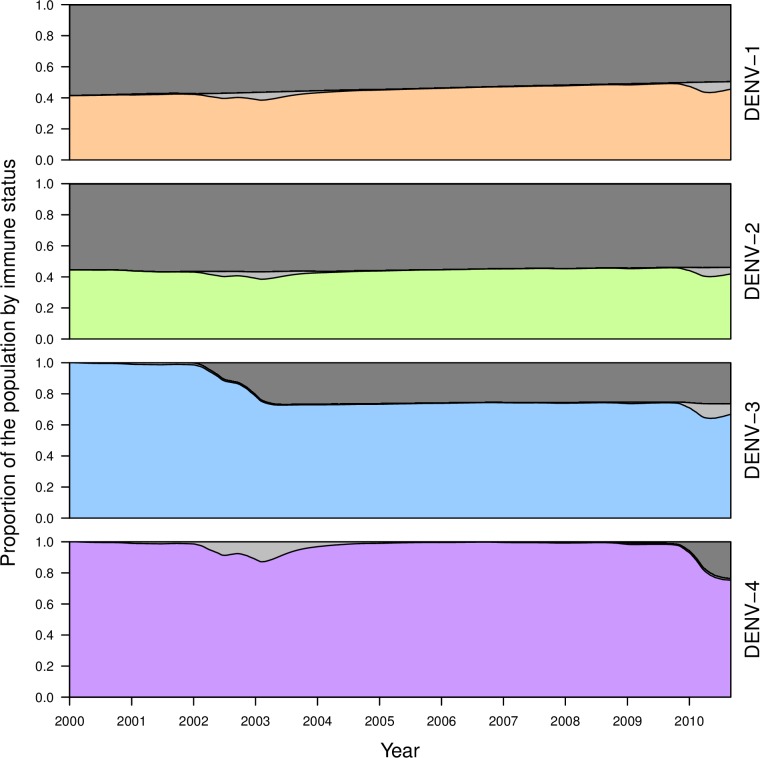
Fig 4. Proportion of the population during the period of the calibration that was not immune to a given serotype (colored), temporarily cross-immune to that serotype (light gray), or permanently immune to that serotype (dark gray).
Values shown reflect medians across 1,000 simulations drawing parameters from across the set of particles obtained through the calibration process under default parameter assumptions detailed in Table 2.

