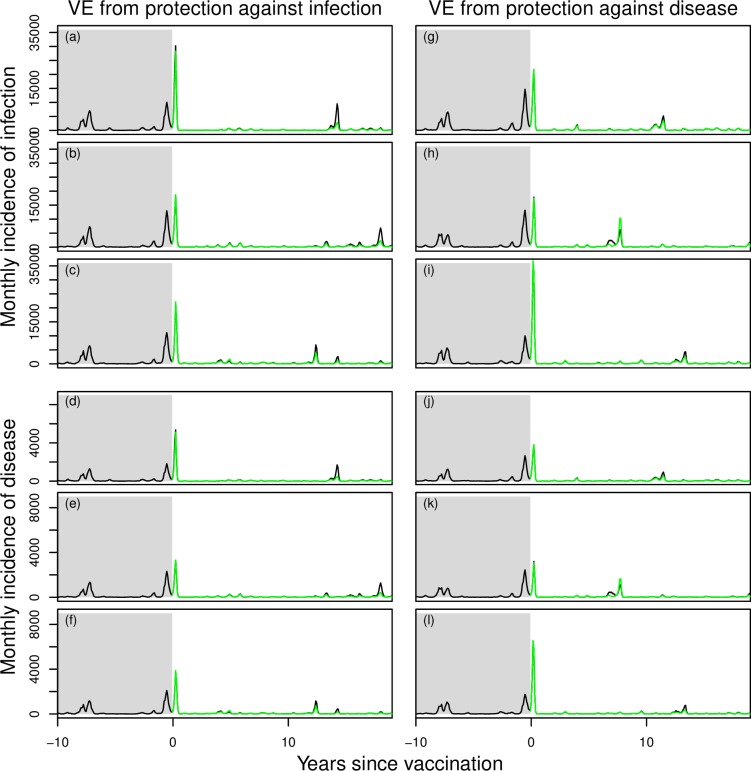
Fig 7. Examples of paired time series of annual incidence of human DENV infections simulated from the model with vaccination (green) and without (black).
Prior to year 0, both simulations in each pair are identical and follow dynamics calibrated as shown in Fig 2. Beginning in year 0, routine vaccination commences in the simulation colored in green, but not in the one in black. Three different realizations are shown for each of two scenarios (left: p = 1; right: p = 0), with different outcomes from the same realization plotted in each of four sets of panels: a, d, g, and j; b, e, h, and k; c, f, i, and l.

