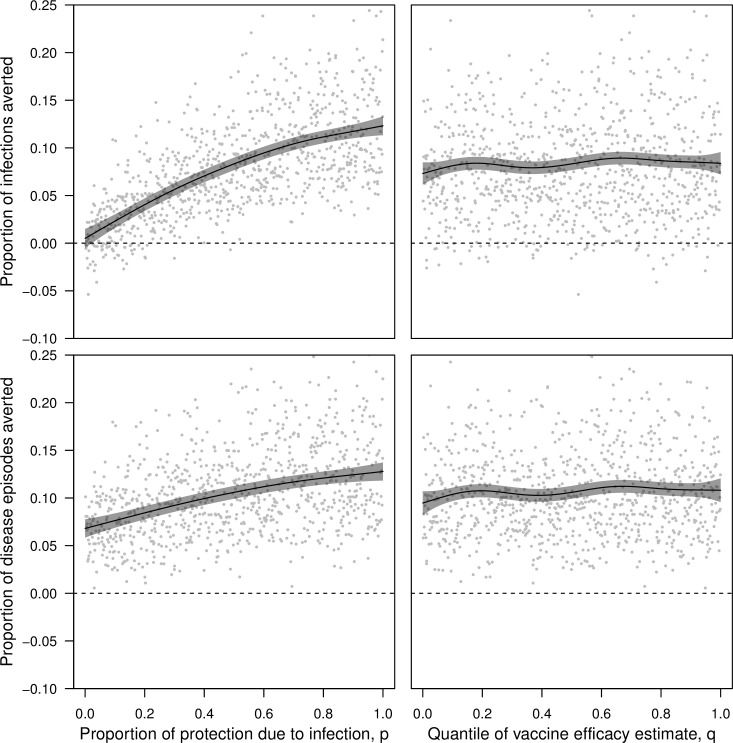
Fig 8. Impacts of vaccination assessed in 1,000 pairs of simulations with and without vaccination under the CYD-TDV vaccine profile.
Simulation pairs varied with respect to the proportion of vaccine efficacy due to protection from infection, p, (left column) and the quantile of estimated vaccine efficacy, q (right column). The proportions of cumulative infections averted (top row) and cumulative disease episodes averted (bottom row) were based on the number of each in the simulation without vaccination minus the number of each in the simulation with vaccination, both following 20 years of routine vaccination of 9-year olds at 80% coverage. Lines show the proportion of cumulative infections and disease episodes averted as a function of p and q, as estimated by a generalized additive model with independent smooth terms for p and q. When one of p or q is varied, the other is held constant at 0.5. Gray bands indicate 95% confidence intervals.

