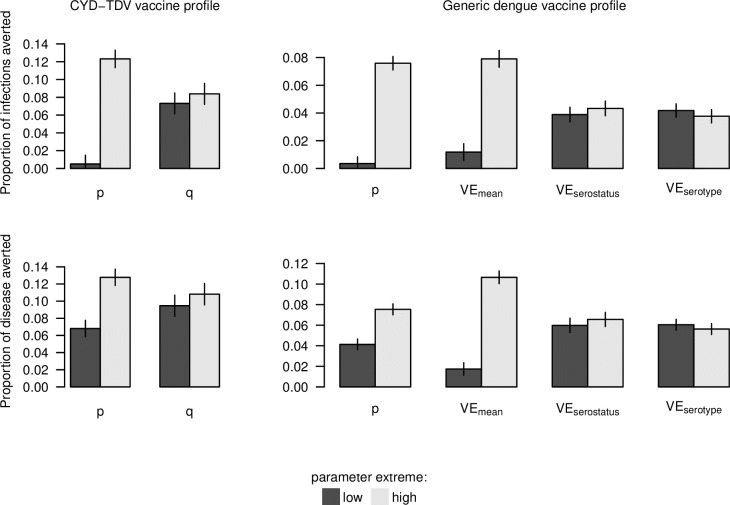
Fig 10. Summary of vaccination impact on infections and disease episodes (rows) under two sets of assumptions about vaccine profile (columns) at extreme values of parameters that varied across simulations (colors).
Bars display point estimates and 95% confidence intervals obtained from fitting generalized additive models to simulation results across the range of each parameter while holding others at the midpoints of their ranges. These values correspond to the extremes displayed in Fig 8 (p, q), Fig 9 (p, VEmean), and S23 Fig (VEserostatus, VEserotype).

