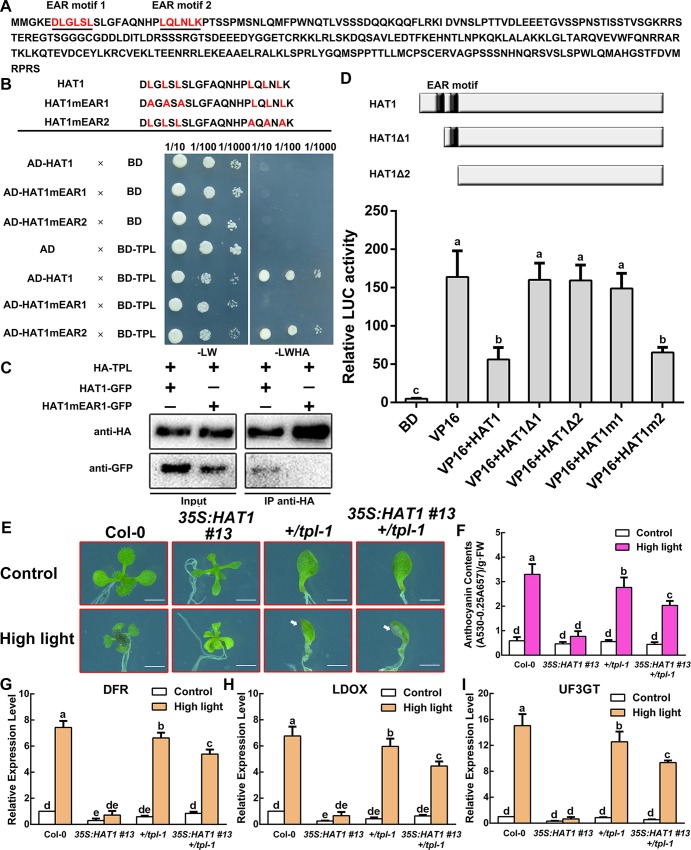
Fig 5. HAT1 interacts with TPL and behaves as a transcriptional repressor.
(A) The amino acid sequence of HAT1 (At4g17460). HAT1 contains two possible EAR motif (underlined, red). (B) Interaction between HAT1 and TPL protein in yeast two-hybrid assays. HAT1mEAR, mutated HAT1 in which the core Leu residues of the EAR motif were substituted to Ala residues. The ability of cells to grow on synthetic dropout medium lacking Leu, Trp, His, and Ade (-LWHA) suggested the interaction. BD, GAL4 DNA binding domain. (C) CoIP analysis for HAT1 and TPL. Co-IP was performed using transgenic Arabidopsis plants co-expressing 35S:HAT1-GFP and 35S:HA-TPL or co-expressing 35S:HAT1mEAR1-GFP and 35S:HA-TPL. HAT1-GFP and HA-MYB75 were detected with the anti-GFP and anti-HA antibodies, respectively. (D) Transcriptional inhibition assays of HAT1 in protoplast. HAT1Δ1 or HAT1Δ2, the EAR motif was deleted in HAT1. HAT1m1 or HAT1m2, mutated HAT1 that the core Leu residues were substituted to Ala residues in EAR motif. BD, empty vector, negative control. VP16, a herpes simplex virus-encoded transcriptional activator protein, positive control. ns, no significant difference; Error bars denote ± SD (n = 3). Different letters represented statistically significant differences (one-way ANOVA, p<0.05). (E) 14-day-old Arabidopsis seedlings of Col-0, 35S:HAT1 #13, +/tpl-1, 35S:HAT1 #13 +/tpl-1 grown on plates under different conditions. Arrowheads represent anthocyanin accumulation in +/tpl-1, 35S:HAT1 #13 +/tpl-1 seedlings. Bars = 0.5 cm. (F) Anthocyanin levels in extracts from seedlings in (E). The experiments were performed in biological triplicate (representing anthocyanin content measured from 15 plants of each genotype and treatment were pooled for one replicate). FW, fresh weight. Error bars denote ± SD (n = 3). Different letters represented statistically significant differences (two-way ANOVA, p<0.05). (G-I) qPCR analysis of DFR, LDOX, and UF3GT expression levels in 14-day-old seedlings in (E) grown on plates under different conditions for 9 h, respectively. Expression levels were standardized to ACTIN 8, the results of Col-0 under control conditions were set at 1. Error bars denote ± SD (n = 3). Different letters represented statistically significant differences (two-way ANOVA, p<0.05).

